. 2016 Oct 12;5:e19532. doi: 10.7554/eLife.19532

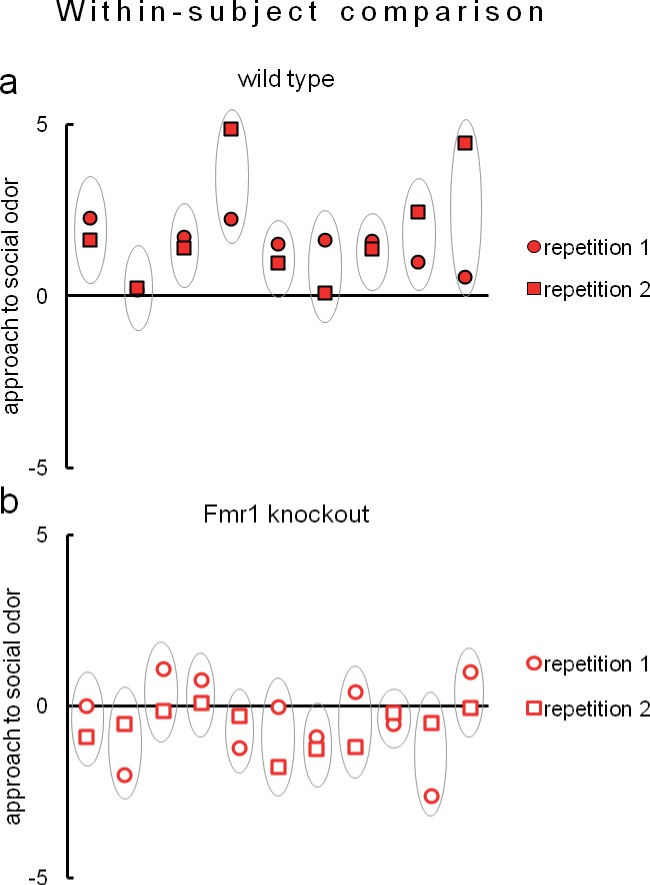
Figure 8. Eco-HAB allows remarkably reproducible assessment of approach to social odor in both (a) wild-type mice (n = 9) and (b) Fmr1 knockouts (n = 11).

Figure 8.

Evaluation of social behavior of subjects was repeated twice in identical Eco-HAB experiments, separated by a 10-day period of regular housing. Each aligned dot and square encircled by an oval represent individual score of approach to social odor for each tested mouse, measured in two subsequent experimental repetitions. Dots are data, while the ovals serve to guide the eye. Data presented are logarithmic values.

DOI: http://dx.doi.org/10.7554/eLife.19532.031

Figure 8—source data 1. We include source data for Figures 6, 7 and 8 concerning reproducibility results of both Eco-HAB measures.
The names of the Excel sheetsrefer to corresponding figures and contain data used for analysis of the behavioral measures obtained by the implementation of Eco-HAB.py software (see Materials and methods).
DOI: 10.7554/eLife.19532.032
Figure 8—source data 2. We include source data for Figures 6, 7 and 8 concerning reproducibility results of both Eco-HAB measures.
The names of the Excel sheetsrefer to corresponding figures and contain data used for analysis of the behavioral measures obtained by the implementation of Eco-HAB.py software (see Materials and methods).
DOI: 10.7554/eLife.19532.033