. 2016 Oct 1;5:e20337. doi: 10.7554/eLife.20337

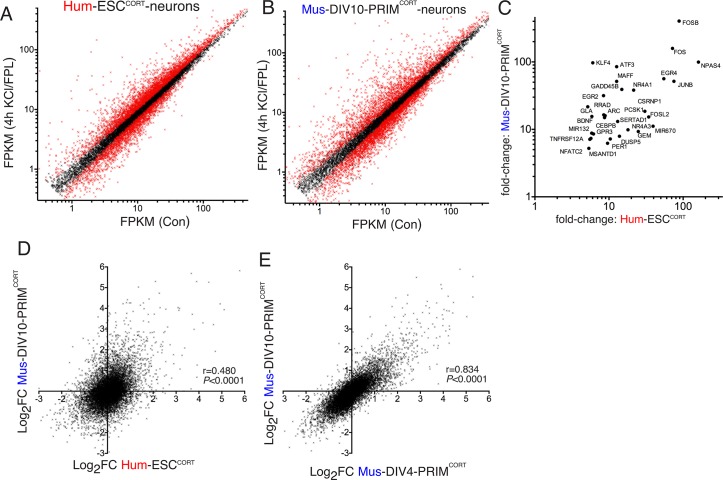
Figure 1. Conservation and divergence in gene regulation in neurons of human and mouse origin.

(A,B) Analysis of gene expression changes induced by KCl/FPL in Hum-ESCCORT-neurons (A) and DIV10 Mus-PRIMCORT-neurons (B). Normalised RNA-seq read density (FPKM) mapping to each gene in RNA extracted from control vs. KCl/FPL-treated neurons is shown (n = 3 independent biological replicates). Genes whose expression was significantly altered by KCl/FPL treatment (Benjamini-Hochberg-adjusted p-value<0.05, calculated within DESeq2) are highlighted in red. (C) Cohort of human:mouse orthologous pairs where both are strongly (>5-fold) and significantly (Benjamini-Hochberg-adjusted p-value<0.05) induced in Hum-ESCCORT-neurons and DIV10 Mus-PRIMCORT-neurons respectively. (D) Correlation of KCl/FPL-induced fold-change in 11,302 ortholog pairs in DIV10 Mus-PRIMCORT-neurons vs. DIV10-Hum-ESCCORT-neurons. (E) Correlation of KCl/FPL-induced fold-change in the same 11,302 genes as in (D) in DIV10 vs. DIV4 Mus-PRIMCORT-neurons.

DOI: http://dx.doi.org/10.7554/eLife.20337.003

Figure 1—source data 1. Data set relating to Figure 1a–e.
DOI: 10.7554/eLife.20337.004
Figure 1—source data 2. Data set relating to Figure 1—figure supplement 1a.
DOI: 10.7554/eLife.20337.005
Figure 1—source data 3. Data set relating to Figure 1—figure supplement 1b.
DOI: 10.7554/eLife.20337.006
Figure 1—source data 4. Data set relating to Figure 1—figure supplement 1c–d.
DOI: 10.7554/eLife.20337.007
Figure 1—source data 5. Data set relating to Figure 1—figure supplement 1e–f.
DOI: 10.7554/eLife.20337.008

Figure 1.

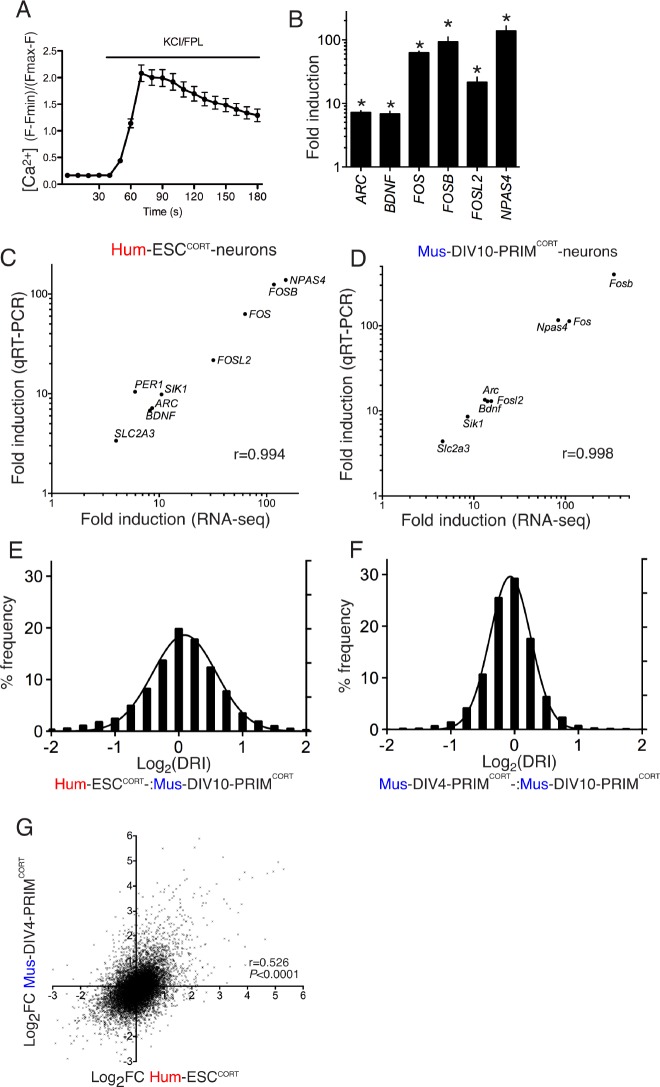
Figure 1—figure supplement 1. Conservation and divergence in gene regulation in neurons of human and mouse origin.

Figure 1—figure supplement 1.

(A) Example fluo-3 Ca2+ imaging trace of KCL/FPL-treated Hum-ESCCORT-neurons. (B) qPCR analysis of the fold induction of the indicated genes in Hum-ESCCORT-neurons after 4h of KCl/FPL treatment. *p=0.0001, 0.0013, 6E-05, 0.0005, 0.0086, 0.0010, 2-tailed t-test (n = 3). (C,D) A comparison of the magnitude of gene induction of a selection of human (C) and mouse (D) genes, as assayed by RNA-seq and by qRT-PCR. In both cases identical sets of 3 independent replicates were assayed and the mean calculated. (E) For the 11,302 orthologous pairs, the 'differential regulation index' (DRI) was calculated, defined as the fold-change (Hum-ESCCORT-neurons) divided by the fold-change (DIV10 Mus-PRIMCORT-neurons). The distribution of the log2 of the DRIs is shown. (F) As for (E) except the DRI was calculated for DIV4 vs. DIV10 Mus-PRIMCORT-neurons. (G) Correlation of KCl/FPL-induced fold-change in 11,302 ortholog pairs in DIV4 Mus-PRIMCORT-neurons vs. Hum-ESCCORT-neurons.