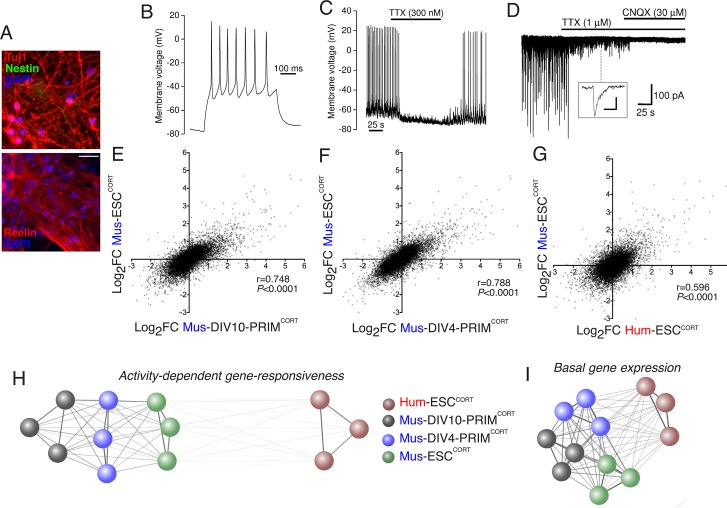
Figure 2. Stem cell origin does not substantially impact on activity-dependent gene responsiveness.
(A) Example immunofluorescence pictures of Mus-ESCCORT-neurons stained for neuronal markers Tuj1 (upper) and Reelin (lower). Note also absence of Nestin staining (upper), a marker of undifferentiated neural precursor cells. Scale = 20 µm. (B) Example trace of a burst of action potentials (APs) induced in Mus-ESCCORT-neurons by current injection (see Materials and methods). (C) Example trace illustrating spontaneous TTX-sensitive AP firing. (D) Example trace illustrating spontaneous TTX-sensitive EPSCs, as well as TTX-insensitive, CNQX-sensitive miniature EPSCs (also see inset; scale bar: 20 pA, 5 ms). Activity returned upon wash out of TTX and CNQX (not shown). (E,F) Correlation of KCl/FPL-induced fold-change in the same 11,302 genes as in Figure 1d,e in Mus-ESCCORT-neurons vs. DIV10 (E) or DIV4 (F) Mus-PRIMCORT-neurons. (G) Correlation of KCl/FPL-induced fold-change in 11,302 ortholog pairs in Mus-ESCCORT-neurons vs. Hum-ESCCORT-neurons. (H) A connection map generated in Cytoscape (Shannon et al., 2003) illustrating the relative determination coefficients (R2) between the fold-inductions of the 11,302 genes studied in each of the three biological replicates of the experiments performed in each of the four different neuronal preparations. The thickness of the connecting line and the attractive force of the connecting nodes are both directly proportional to R2, against a background of constant inter-node repulsion. Note that all mouse neurons of differing developmental stage and origin (primary vs. ES cell) cluster strongly together, with the Hum-ESCCORT-neuronal replicates clustering away from them. (I) A connection map generated as for (H) but illustrating the relative determination coefficients (R2) between the basal expression levels (FPKM) of the 11,302 genes studied in each of the three biological replicates of the experiments performed in each of the four different neuronal preparations.
DOI: http://dx.doi.org/10.7554/eLife.20337.010


