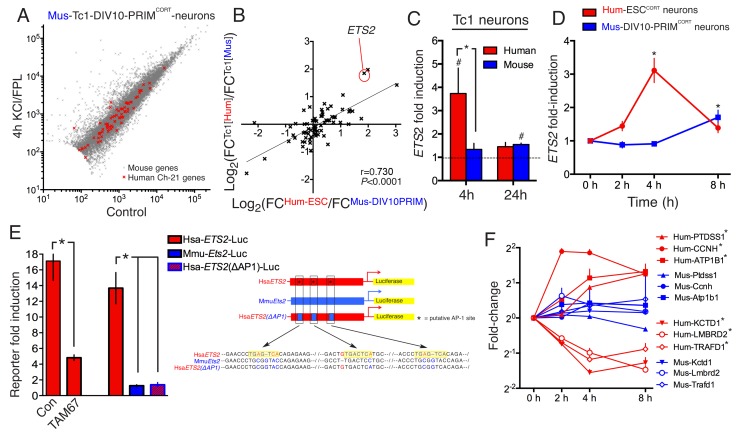
Figure 3. DNA sequence is a contributing factor to species-dependent gene responsiveness to neuronal activity.
(A) Analysis of gene expression changes induced by KCl/FPL in mouse Tc1 neurons. Mouse genes are shown in grey, human chromosome-21 (Hsa-21) genes in red. (B) The graph concerns 72 orthologous pairs whose human ortholog is on Hsa-21 and carried by the Tc1 mouse strain, and which meets expression cut-off (100 reads). For each pair, the differential responsiveness index (DRI) was calculated from the species-separated Tc1 neuron RNA-seq data (see text), and plotted against the DRI calculated from separate neuronal preparations (Hum-ESCCORT-neurons vs. DIV10 Mus-PRIMCORT-neurons, as was done in Figure 1—figure supplement 1e). (C) KCl/FPL-induced fold induction of the human (red) and mouse (blue) orthologs of Hsa-21 gene ETS2, analysed side-by-side in Tc1 neurons. *p=0.035. unpaired t-test; # indicates p=0.0464, 0.0026 (left to right) vs. unstimulated control (4 hr, n = 7; 24 hr, n = 3). (D) Kinetics of KCl/FPL-induced ETS2 induction in Hum-ESCCORT-neurons vs. DIV10 Mus-PRIMCORT-neurons. *p=0.0017, 0.004 (left to right), unpaired 1-way ANOVA vs. control (Hum-ESCCORT-neurons: n = 3 (2 hr, 8 hr), n = 6 (4h); DIV10 Mus-PRIMCORT-neurons: n = 4 (E) The indicated firefly luciferase reporters based on human (Hsa) or mouse (Mmu) ETS2 promoters (See (Right) for schematic) plus a pTK-renilla control were transfected into mouse cortical neurons, treated ± KCl/FPL after which firefly:renilla luciferase ratio was measured, and fold-induction calculated. For comparing the effect of TAM67, a control vector (encoding β-globin) was used. *p=0.0015, 0.0015, 0.0015, 2-tailed paired t-test (n = 3). (F) Kinetics of gene regulation of 6 human:mouse ortholog pairs that show quantitative differences in activity-dependent regulation in Hum-ESCCORT-neurons vs. all mouse neuronal preparations from prior RNA-seq analyses. Analysis was performed in Hum-ESCCORT-neurons vs. DIV10 Mus-PRIMCORT-neurons (n = 3,4 respectively). At the timepoints studied, three of these pairs exhibit quantitatively higher induction in human neurons, and three stronger repression in human neurons. *p=<0.0001, 0.0004, 0.0005, <0.0001, <0.0001, 0.0073 (top to bottom, 2-way ANOVA, p-value corresponds to the main species effect).
DOI: http://dx.doi.org/10.7554/eLife.20337.015
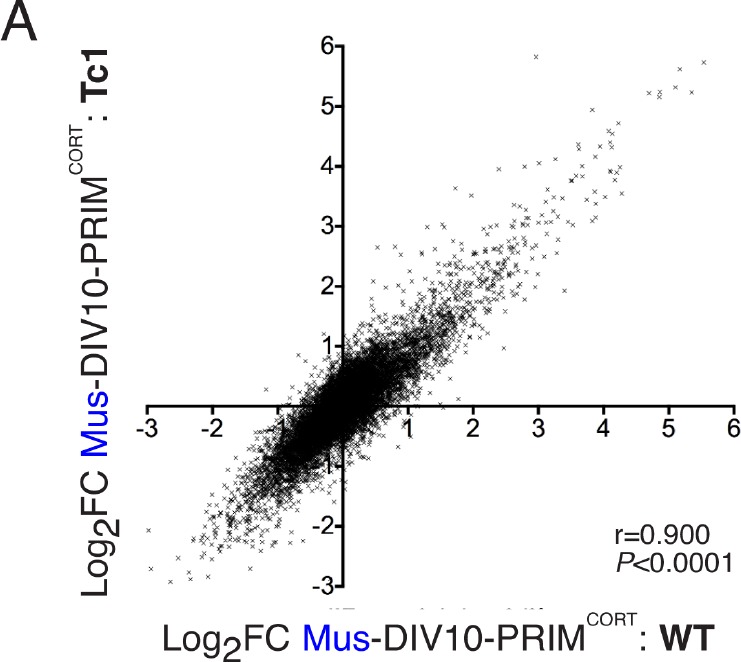
Figure 3—figure supplement 1. Inducibility of mouse genes in wild-type and Tc1 neurons strongly correlate.


