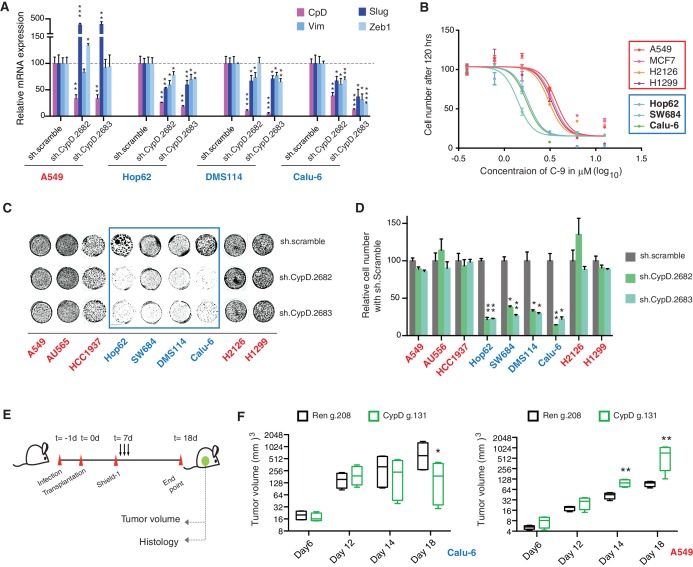
Figure 5. CypD activity is required for phenotypes associated with TP53 exon-6 truncating mutations.
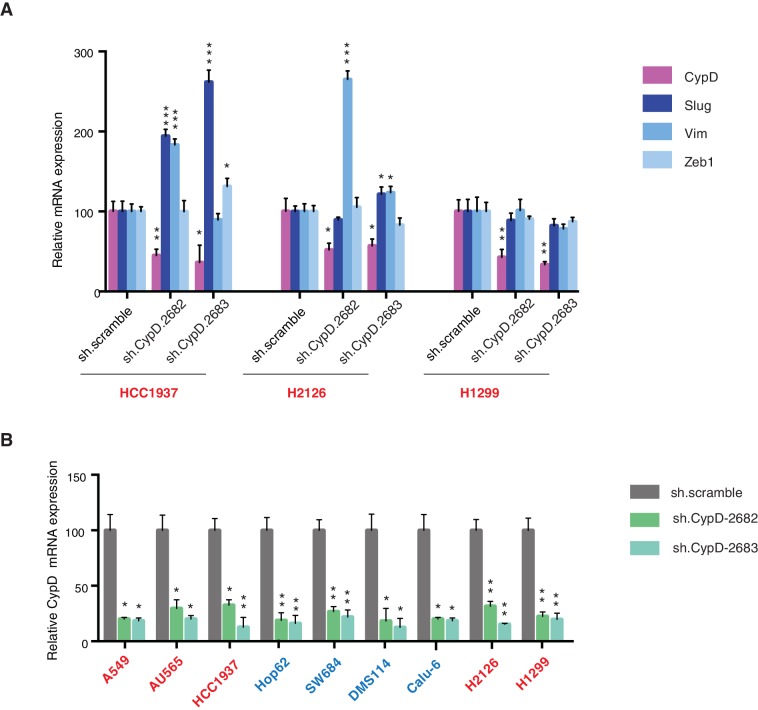
(A) CypD is required for maintaining cells in a mesenchymal like state. The chart represents mRNA expression analysis of the indicated genes in A549 (p53-WT), Hop62 (p53-psi), DMS114 (p53-R213*) and Calu-6 (R196*) cell lines after CypD knockdown. Cells harboring p53-psi or TP53 exon-6 nonsense mutations are indicated in blue. mRNA expression was quantified by SYBR-green-based RT-qPCR. Each bar is the average of 3 replicates and represents mRNA expression of the indicated gene relative to GAPDH (p-value, *<0.05, **<0.005 and ***<0.0005, unpaired t-test). See Figure 5—figure supplement 1A for analysis in additional cell lines. (B) CypD is required for the survival of cells harboring p53-psi splice or TP53 exon-6 truncating mutations. The graph represents cell survival curve of indicated cell lines when treated with CypD inhibitor C-9 for 120 hr. (C) Crystal violet staining of the indicated cell lines upon CypD knockdown with two independent shRNAs. A scramble shRNA was used as negative control. The quantification of knockdown efficiency is provided in Figure 5—figure supplement 1B. (D) The chart depicts the percentage of viable cells 8 days after infection with the indicated CypD shRNA constructs relative to scramble shRNA control. Each bar represents the mean of 9 individual replicates (p-value *<0.0005 and **<0.00005, unpaired t-test). (E) Workflow of the transplantable model system used in this study. A549 (p53-WT) and Calu-6 (p53 R196*) cells were transduced with an inducible CRISPR-Cas9 (DD-Cas9) targeting CypD (CypD g.131) and Renila (Ren g.208). Cells were transplanted sub-cutaneously in immune-deficient mice. When the tumors reached an approximate size of 4–5 mm in diameter, mice were treated with Shield-1 (1 µg). Tumor volume was determined at the indicated time points. See Supplementary file 5 for sgRNA sequences. (F) The charts illustrate quantification of tumor volumes (mean ± SD) in the indicated cohorts at given time points (n = 4, p-value *<0.05, unpaired t-test). Validation of CypD inactivation is provided in Figure 5—figure supplement 2.


