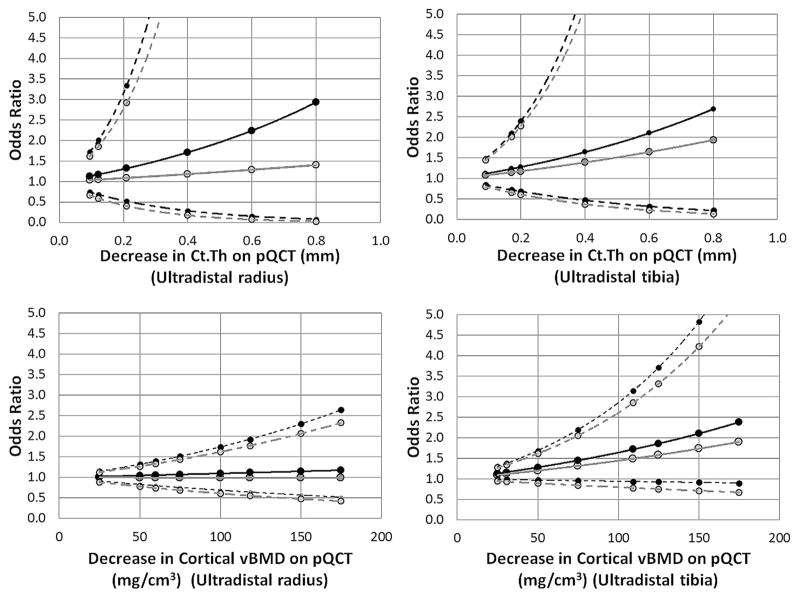
Fig. 1.
Odds for fragility fractures associated with different magnitudes of pQCT bone variable differences. Odds ratios were computed from binary logistic regression models for different values of Ct.Th (top) and cortical vBMD (bottom) as obtained using high-resolution peripheral quantitative computed tomography images of the radius (left) and tibia (right). Dashed lines represent 95% confidence intervals. Black lines and points represent base models, and gray lines and points represent models after adjustment for age. Ct.Th, cortical thickness; pQCT, peripheral quantitative computed tomography; vBMD, volumetric bone mineral density.

