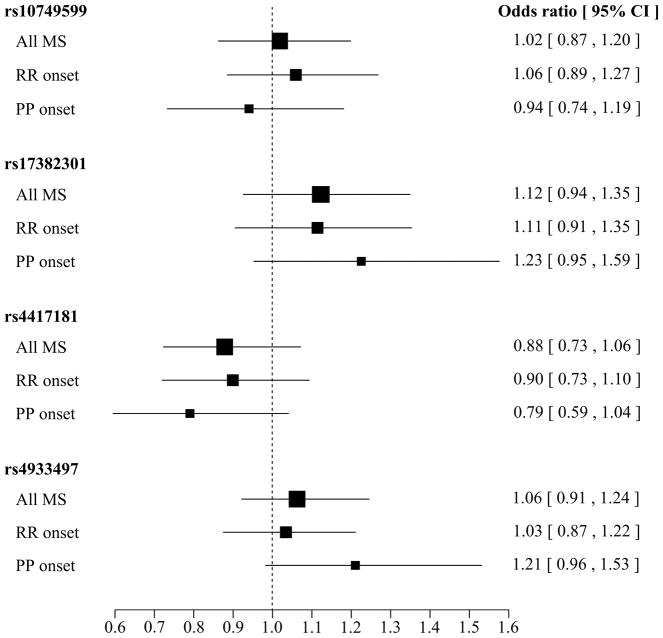
Figure 1.
Forest plot of the odds ratio (OR) and 95% confidence intervals (CI) for rs1074599 (GG/GC vs. CC), rs4417181 (TT/TC vs. CC), rs4933497 (AA/AG vs. GG), rs17382301 (GG/GA vs. AA). Box dimensions are proportional to the sample size, with the horizontal line indicating the OR and corresponding 95%CI.

