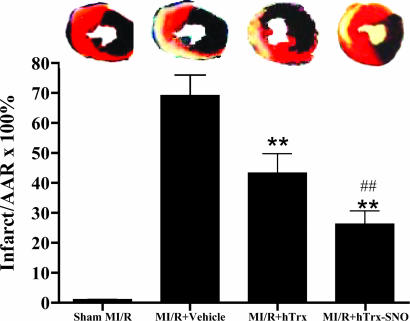
Fig. 4.
Myocardial infarct size in the different treatment groups. (Upper) Representative photomicrographs of heart sections obtained from mice subjected to sham myocardial ischemia/reperfusion (MI/R), MI/R treated with vehicle, MI/R treated with native hTrx, or S-nitrosated hTrx. Blue portion, nonischemic, normal region; red portion, ischemic/reperfused, but not infarcted region; negatively stained portion, ischemic/reperfused, infarcted region. (Lower) Bar chart of myocardial infarct size expressed as percent of total ischemic/reperfused area (area-at-risk; means ± SEM of 10-12 mice per group). **, P < 0.01 vs. vehicle-treated ischemic/reperfused hearts; ##, P < 0.01 vs. hTrx.

