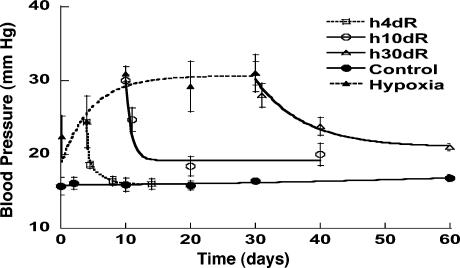
Fig. 2.
Change in blood pressure in the pulmonary arterial trunk during the periods of control, hypoxia, and recovery. The data in hypoxia period are from refs. 8 and 9. H4dR, 4 days of hypoxia followed by recovery; H10dR, 10 days of hypoxia followed by recovery; and H30dR, 30 days of hypoxia followed by recovery. Plotted values are mean ± SD, with SD shown by flags.

