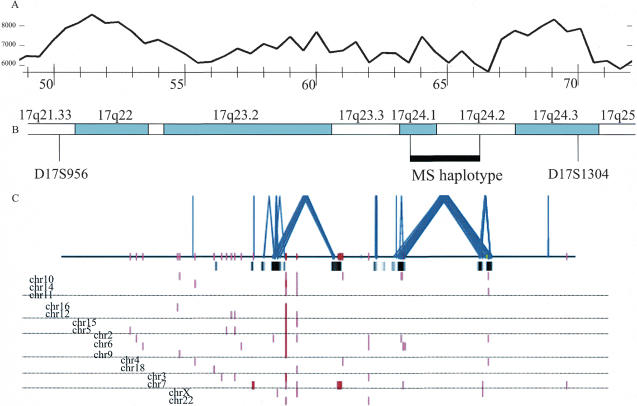
Figure 2.
Segmental duplications within 17q22–17q24 and their position in relation to chromosomal bands, MS haplotype, and palindromic sequence distribution. (A) The frequency of palindromes >6 bp. For details, see Figure 4. (B) The chromosomal banding, STS markers, and the shared MS haplotype (black horizontal bar). (C) The pattern of interchromosomal (red) and intrachromosomal segmental duplications (blue) based on the whole-genome analysis comparison method (>1 kb and >90% sequence identity) is shown for 18 Mb between markers D17S956and D17S1304. Highly homologous (>96% sequence identity) regions confirmed by whole-genome shotgun sequence detection are shown as black bars below the horizontal line.

