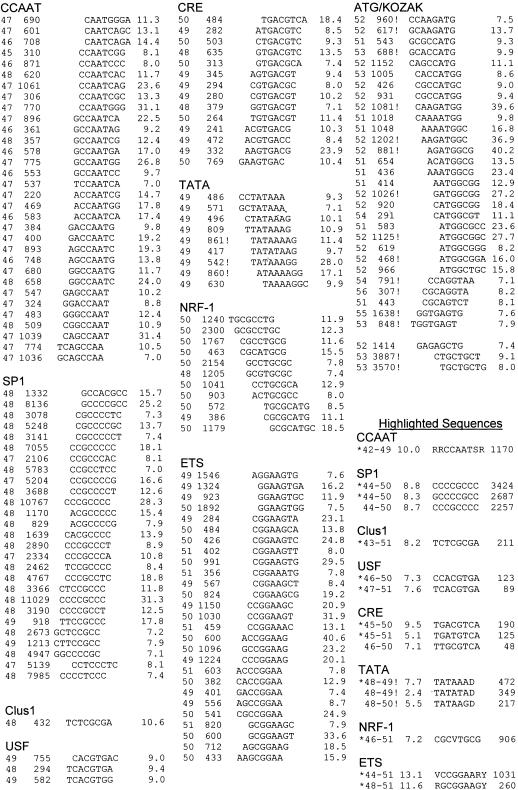
Table 1.
DNA 8-mer Sequences That Cluster
One hundred fifty-six DNA sequences are grouped into related sequences and arranged by their peak position relative to the TSS. From the left the table contains the most abundant bin, the number of times the sequence occurs in the distribution, the 8-mer sequence, and finally the P value (see text). The end of the table contains consensus sequences. Here the leftmost numbers are the bins defining the peak, followed by the clustering factor (CF), the consensus sequence, and finally the number of occurrences of the sequence in the bins that comprise the peak. Exclamation point (!) denotes sequences that are at least threefold more abundant in the maximum bin on the DNA strand presented in the table than on the opposite strand. The asterisk (*) denotes sequences used in Tables 2 and 3. IUPAC letters used to represent degenerate bases are R (G,A), W (A,T), Y (T,C), K (G,T), V (G, C, A), D (G,A,T), and N (A,T,G,C).

