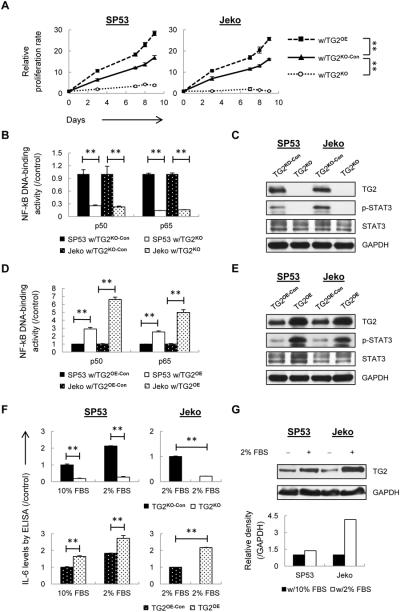
Figure 1. IL-6/STAT3 signaling is dependent on TG2/NF-kB signaling axis in MCL.
(A) Cell proliferation of TG2KO and TG2OE cells were determined using Trypan Blue and MTT assays. The controls were mock-transfected cells. (B) The DNA binding activities of p50 and p65 were measured using nuclear extracts from TG2KO or control (TG2KO-Con) cells. The colorimetric values in TG2KO cells were normalized to the controls. (C) STAT3 and p-STAT3 (Tyr705) were measured using immunoblotting with GAPDH as a loading control. (D) The DNA binding activities of p50 and p65 were measured using nuclear extract from TG2OE or control (TG2OE-Con) cells. The colorimetric values in TG2OE cells were normalized to the controls. (E) STAT3 and p-STAT3 were measured using immunoblotting with GAPDH as a loading control. (F) ELISA analysis of IL-6 using conditioned media from TG2KO and TG2OE cells under normal conditions (10% FBS) or low-serum conditions (2% FBS). (G) TG2 levels were analyzed using immunoblotting and the relative intensity of the bands is shown compared with cells in normal conditions. The data are shown as the mean ± S.D. **p < 0.01.

