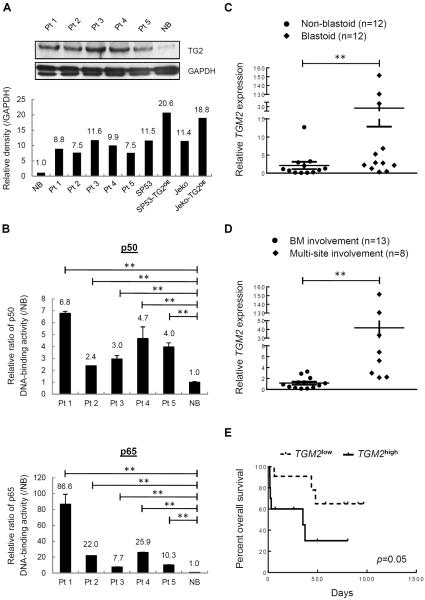
Figure 6. Expression patterns of TG2 and NF-kB in MCL patients.
(A) TG2 levels were measured in MCL patients (n=5) and normal B (NB) cells (n=1). The intensity of the bands in MCL patients (Figure 6A) and cell lines (Figure 1E) were analyzed using ImageJ software and normalized to GAPDH. The values compared to NB cells are indicated. (B) Nuclear extracts from MCL patients (n=5) and NB cells (n=1) were subjected to ELISA assays to evaluate p50 and p65 DNA-binding activities. The colorimetric values in MCL samples were normalized to the NB cells. (C) TGM2 mRNA levels were measured in CD19+ B cells isolated from MCL blastoid patients (n=12) or non-blastoid patients (n=12). (D) TGM2 mRNA levels of MCL patients with multi-site infiltrations besides BM involvement (n=8) were compared to those with solely BM involvement (n=13). (E) Overall survival of MCL patients (n=24) (p=0.05, Mantel-Cox curve analysis). TGM2high and TGM2low refer to the upper and lower 50% of the TGM2 levels in MCL patients, respectively. The results are shown as the mean ± S.D. **p < 0.01.

