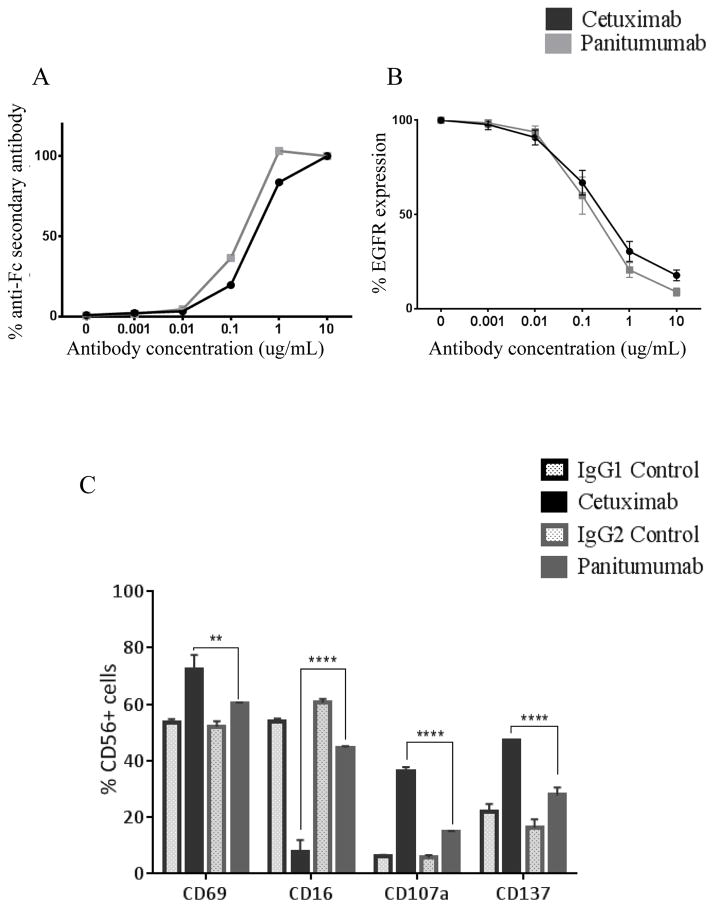
Figure 1. Cetuximab and panitumumab bind EGF receptor similarly but cetuximab activates PBMC to a greater extent than panitumumab.
(A–B) Binding of cetuximab (IgG1) and panitumumab (IgG2) specific monoclonal antibodies (mAbs) to JHU-029 HNSCC cells. Cells were treated with increasing concentrations of either cetuximab or panitumumab (0.001–10 μg/mL) for 30 minutes at 4°C then stained with either FITC–labeled Fc-specific Ab, or EGFR Ab and analyzed by flow cytometry. Graphs show the percentage of FITC positive cells obtained at each concentration of mAb. (C) Whole PBMC from healthy donors were co-cultured with JHU-029 cells and treated with 10 μg/mL of cetuximab, panitumumab or isotype controls (IgG1 or IgG2) for 24h then surface expression of activation markers, CD69, CD16, CD107a and CD137 were measured by flow cytometry. PBMC treated with cetuximab express significantly higher activation markers compared to cells treated with either control antibodies or panitumumab. Data are mean + SEM, **p<0.01, ****p<0.0001 cetuximab compared with panitumumab.

