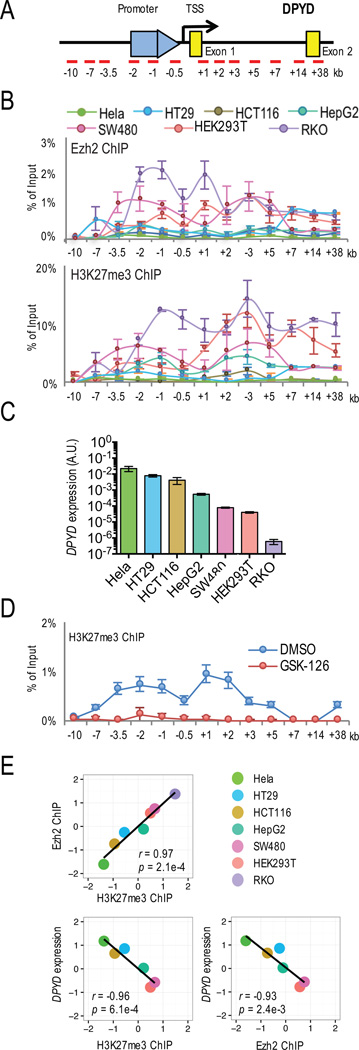
Figure 3. Enrichment of H3K27me3 and Ezh2 on the DPYD promoter and effect on DPYD expression.
A. Schematic of the qPCR primer placement relative to the DPYD promoter, TSS, and first two exons is presented. B. Ezh2- (upper panel) and H3K27me3- (lower panel) associated genomic DNA from the indicated cell lines was obtained by chromatin immuno-precipitation (ChIP) and the enrichment at specific genomic regions was quantified by qPCR using primers indicated in (A). C. DPYD expression in Hela, HT29, HCT116, HepG2, SW480, HEK293T and RKO cells was measured. D. H3K27me3 enrichment was measured by qPCR using ChIP DNA from HCT116 cells treated with 1 µM GSK-126 or DMSO. E. Pearson’s correlation coefficients were calculated for DPYD, Ezh2 enrichment and H3K27me3 enrichment at the DPYD promoter using the sum of relative ChIP enrichment at −2 kb, −1 kb, −0.5 kb and +1 kb. DPYD mRNA and ChIP enrichment level were log2 transformed and standardized to z score.

