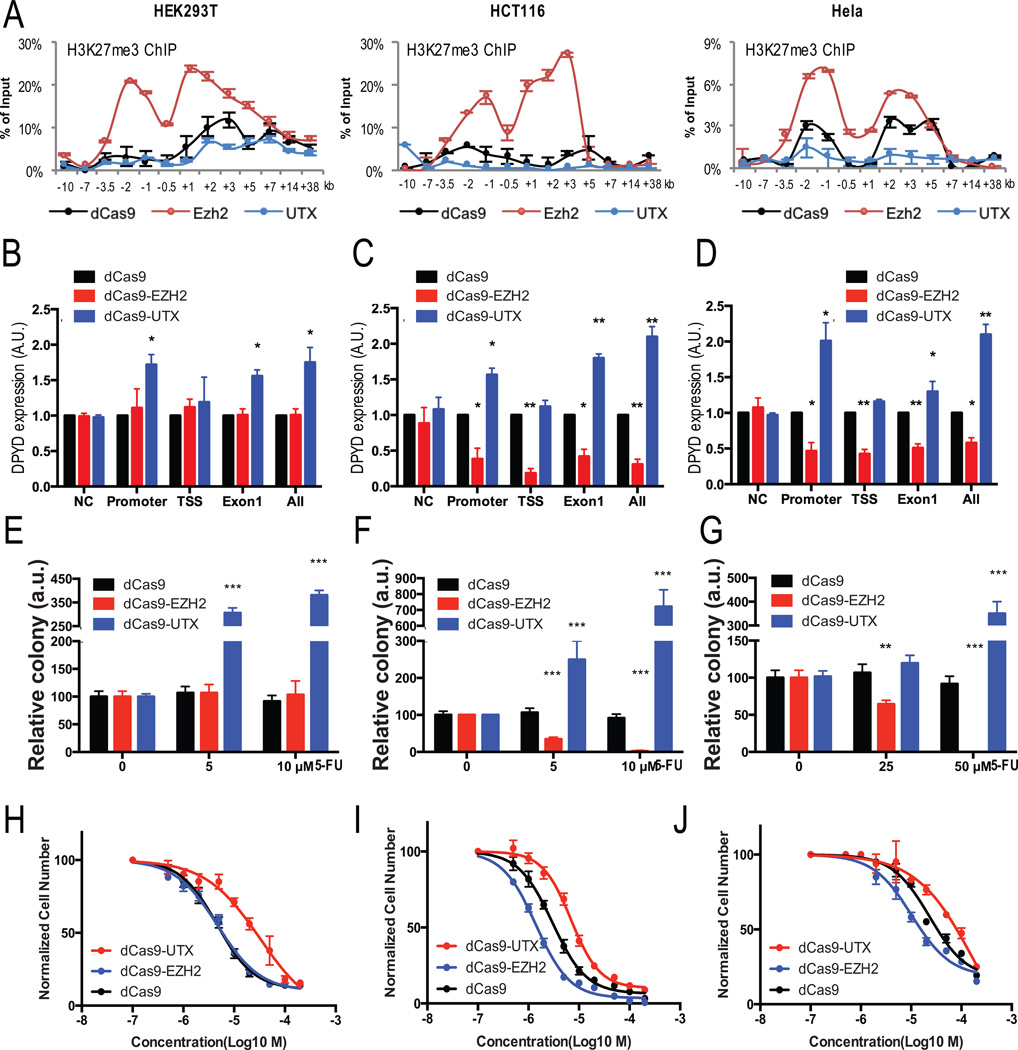
Figure 6. Regulating H3K27me3 specifically at the DPYD promoter changed DPYD expression and affected 5-FU sensitivity.
A. H3K27me3 enrichment at the indicated regions (relative to DPYD TSS) was measured by ChIP-qPCR in HEK293T (left), HCT116 (center), and Hela (right) cells expressing dCas9 (control), dCas9-Ezh2, or dCas9-UTX and gRNAs targeting the promoter, TSS and 1st exon (see Figure S5A for the location of gRNA targets). B–D. DPYD expression was measured in HEK293T (B), HCT116 (C), and Hela (D) cells expressing dCas9, dCas9-Ezh2 or dCas9-UTX and gRNA targeting indicated positions. E–G. HEK293T (E), HCT116 (F), and Hela (G) cells co-expressing gRNAs targeting promoter and the indicated dCas9 constructs were treated with the indicated concentration of 5-FU. Colonies were counted after four weeks. H–J. IC50 values for 5-FU were calculated for HEK293T (H), HCT116 (I), and Hela (J) cells co-expressing gRNAs targeting promoter. In all panels means +/− SD are represented by bars and whiskers. * p<0.05; ** p<0.01; *** p<0.001.

