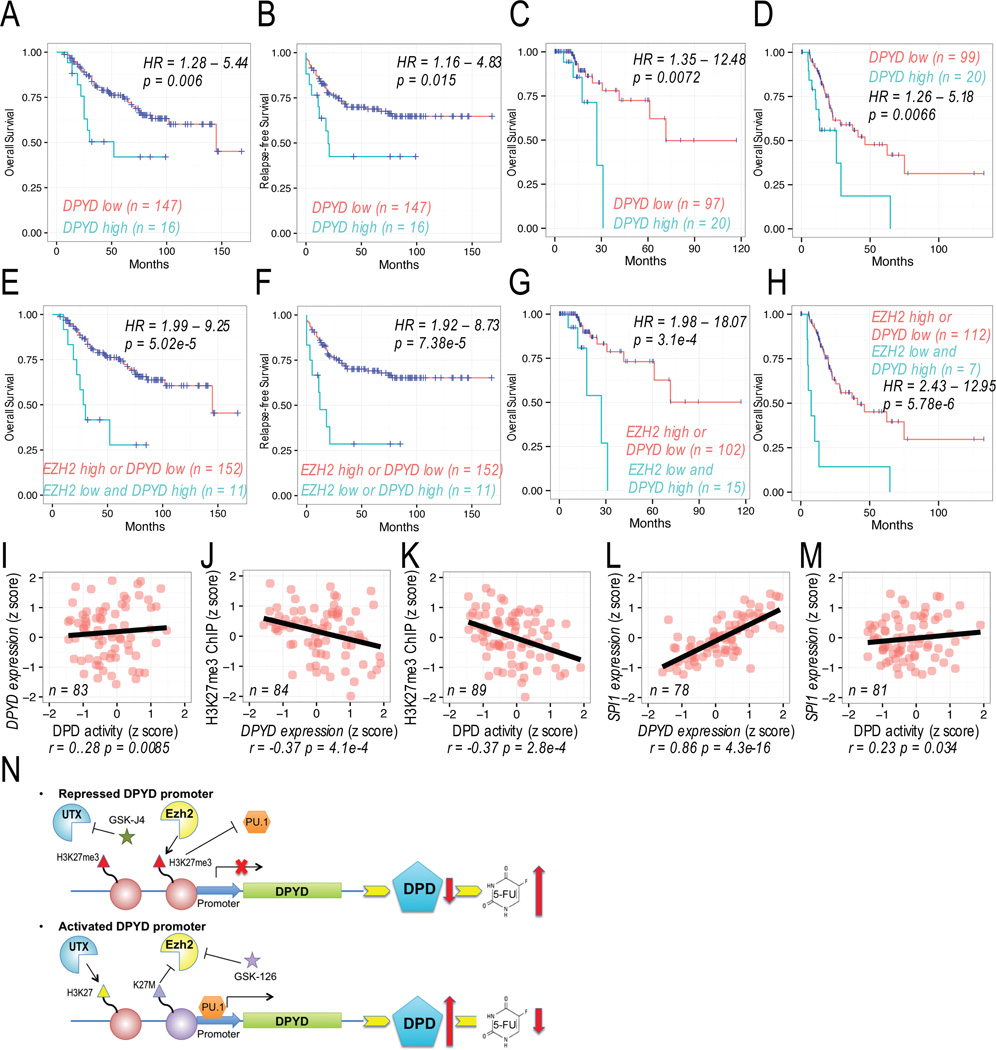
Figure 7. Role of Ezh2 in predicting DPYD expression and 5-FU response.
A–B. Overall survival (A) and relapse-free survival (B) were determined for 5-FU treated colon/rectal cancer patients in GSE40967 dataset stratified by DPYD expression. C–D Overall survival was determined for 5-FU treated colon/rectal cancer (C) and gastric cancer (D) in TCGA dataset. E–F. Overall survival (E) and relapse-free survival (F) were determined for 5-FU treated colon/rectal cancer patients stratified by DPYD and EZH2 expression level as indicated. G–H Overall survival was determined for 5-FU treated colon/rectal cancer (G) and gastric cancer (H) patients stratified by DPYD and EZH2 expression levels as indicated. I–M. Pearson’s correlations were determined for DPD activity, DPYD expression, H3K27me3 enrichment on the DPYD promoter, and SPI1 expression in peripheral mononuclear cells from healthy volunteers. N. A model of epigenetic regulation of the DPYD promoter and PU.1 accessibility is shown together with the effect on DPD expression and resultant 5-FU catabolism.

