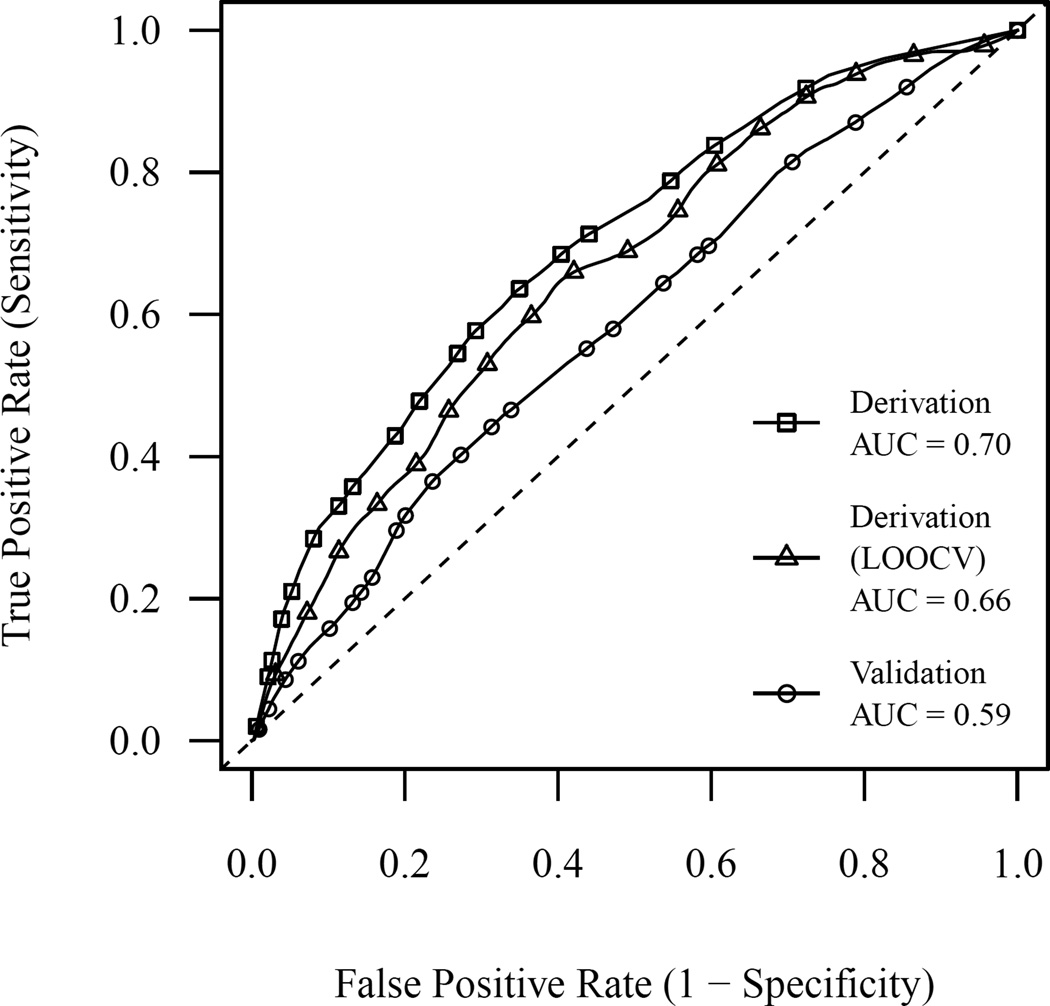
Figure 1.
ROC curve for the prediction model as tested in the derivation and validation cohorts. Curves are shown for the model tested in the derivation cohort, estimated using standard methods and leave-one-out cross-validation (LOOCV), as well as in the validation cohort, estimated using standard methods.

