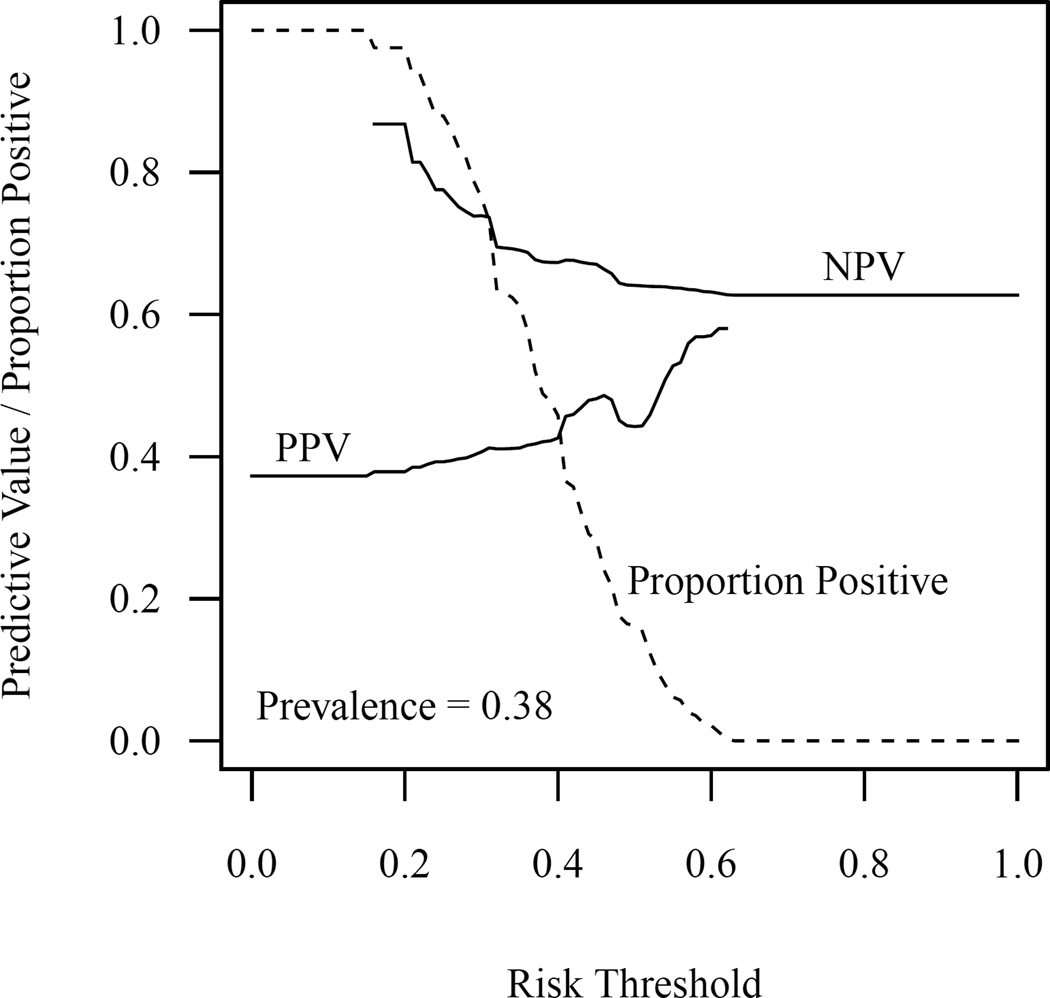
Figure 2.
Positive predictive value, negative predictive value, and proportion of patients classified as positive across the range of values for the risk threshold. Individuals with a predicted probability of prolonged dose titration are classified as positive. The absence of a curve in a given region indicates that the measure is undefined in that region; for instance, positive predictive value is undefined when no patients are classified as positive.

