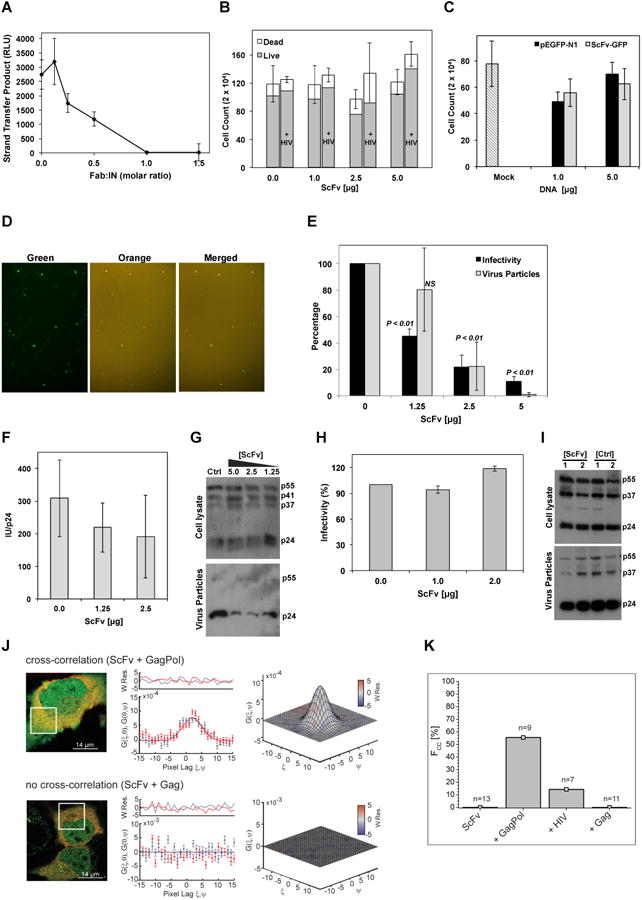
Figure 3. Fab2 inhibits IN activity and virus particle production.

A) In vitro strand-transfer activity of IN-Fab2 complex at various Fab:IN molar ratios. RLU: relative luminescence units. Error bars represent standard errors of mean from three repeats. B) Viability of cells transfected with ScFv-GFP at various concentrations in the absence or presence of HIV-1 plasmid (+ HIV). Error bars represent standard error from mean (total cell count) of three biological repeats. C) HIV-1 infectivity of MAGI-cells expressing various concentrations of pEGFP-N1 or ScFv-GFP plasmids. Mock cells were not transfected with DNA. Error bars represent standard deviations from mean of four repeats. Cell counts indicate blue infected MAGI cells. D) Fluorescent microscopy analysis of 293T cells expressing ScFv-GFP and infected with Kusobira-Orange lentivirus. Superposition of green and orange panels (merged) shows that ScFv-GFP expressing cells (green) are also infected with the lentivirus (orange). E) HIV-1 infectivity assay of viruses produced from cells containing various ScFv-GFP concentrations (black bars) and the analysis of p24 released into the producer-cell medium (gray bars). Error bars represent standard deviation from mean of three biological repeats. P-values (one-way ANOVA) calculated in comparison to control samples. NS: insignificant. F) Relative infectivity (infectious units (IU) divided by the amount of p24 (ng/ml)). G) Western blot analysis (using α-p24 antibodies) of lysates from 293T HIV-1 producer cells (cell lysate) co-transfected with ScFv-GFP and HIV-1 plasmid as well as of released virus (viral particles) as affected by various DNA amounts (μg) of transfected ScFv-GFP or pEGFP-N1 as control (ctrl). Gag polyprotein (p55), p41 and p37 intermediates and mature capsid (p24) are labeled. H) Virus infectivity of HIV-1 produced in cells expressing Δ-IN virus, Vpr-IN, and ScFv-GFP or GFP as control. Error bars represent standard deviation from mean of three biological repeats. I) Western blot analysis of cell lysates and virus particles released to culture media of samples from panel-E. Plasmid DNA amounts used for transfection are indicated (μg). J) ccRICS analysis of ScFv-GFP cytosolic interactions with Gag/Gag-Pol polyproteins. Left panel: representative dual-color fluorescence images of cells expressing ScFv-GFP (green) and Gag-Pol.mCherry (red, top panel) or Gag.mCherry (red, bottom panel). White box indicates the region analyzed using ccRICS. Middle panel: cross-sections of experimental SCCF (data points) and fit (lines) for both fast (ξ) and slow (ψ) scanning axes. Right panel: 3D representations of SCCF. Color-coding represents values of weighted residuals of the fit (W.Res.). K) Percentage of cells (Fcc) showing positive cross-correlation amplitudes (n=number of cells measured).
