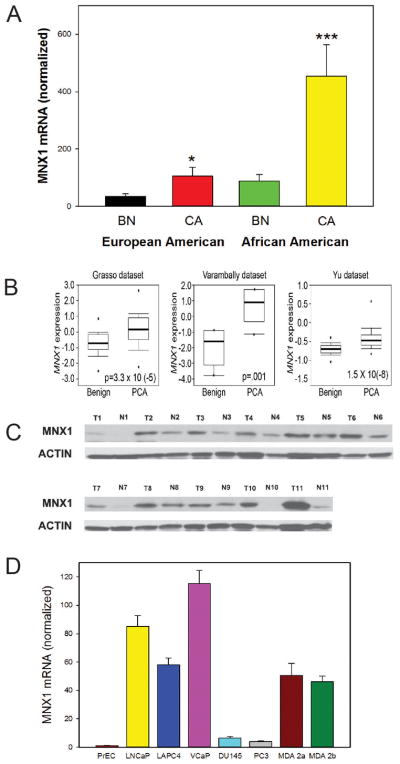
Figure 2. Expression of MNX1 in PCa.
A. MNX1 mRNA levels in EA and AA PCa and benign tissues by Q-RT-PCR. Asterisks indicate statistically significant differences between cancer and benign tissues. Mean +/−SEM; * p<.05; *** p<.001 by t-test B. Examples of Oncomine datasets with increased expression of MNX1 relative to benign tissues; p value shown in bar and whisker plot. C. Western blot on MNX1 from PCa and matched benign tissues from AA men. β-actin is a loading control. D. Expression of MNX1 mRNA in primary prostatic epithelial cells (PrEC) and PCa cell lines.

