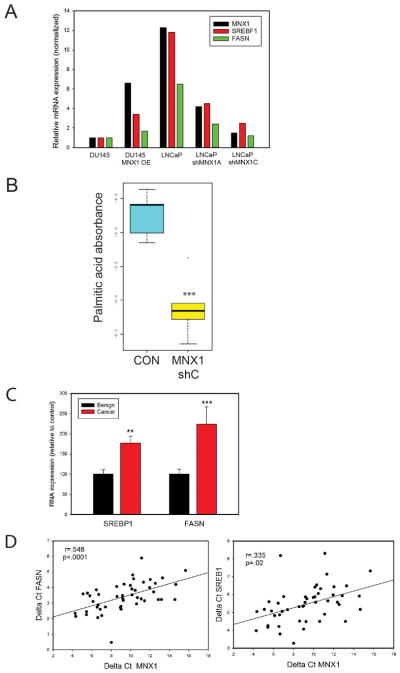
Figure 6. MNX1 regulates lipid synthesis.
A. Expression of MNX1, SREBF1, and FASN in DU145 overexpressing MNX1 or LNCaP with MNX1 knockdown using two different shRNAs versus controls. Data is expressed as percent of vector control for DU145 for each gene. Means of duplicate or triplicate determinations are shown. B. Palmitic acid content of LNCaP xenograft tumors versus scrambled controls (see Fig 3D); *** p<.001 by t-test. C. SREBP1 and FASN mRNA expression in AA benign prostate and PCa tissues. Mean +/− SEM is shown. ** p<.01; *** p<.001; Mann Whitney. D. Correlation between SREBP1 or FASN with MNX1 mRNA in AA PCa by Pearson Product Moment. Correlation coefficient and p-value are shown.

