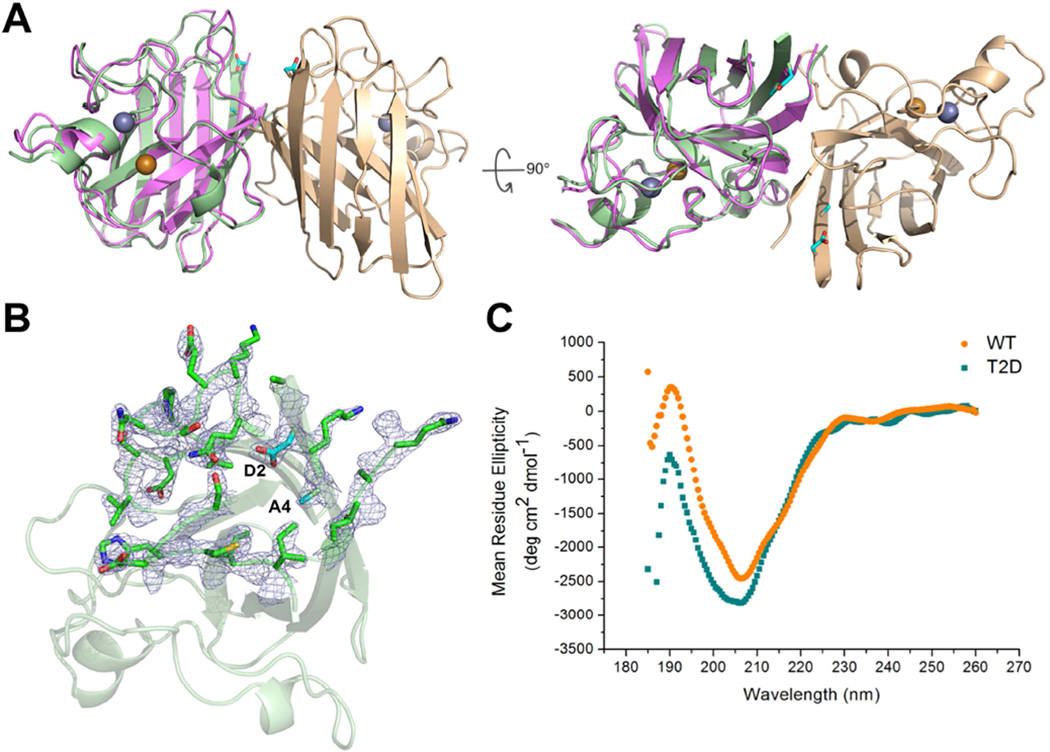
Figure 1. T2D-SOD1 and WT-SOD1 have similar structures in crystals and in solution state.
(A) Overall ribbon diagram of the T2D-SOD1 homodimer (PDB: 5K02) with Zn2+ (silver) and Cu2+ (golden) shown in spheres. The superposition of T2D- (light green and light brown) and WT-SOD1 (purple, PDB: 1SPD) in one subunit indicates the minor structural change in the loop regions. The side chains of D2 and A4 are indicated as cyan sticks. (B) Electron density map of D2 residue and surrounding residues (i. 22–29, 107–113) in one subunit. (C) CD spectra of T2D-SOD1 (cyan square) and WT-SOD1 (orange circle) indicate they both have β-sheet structure in solution. See also Figure S1, S2 and S3.

