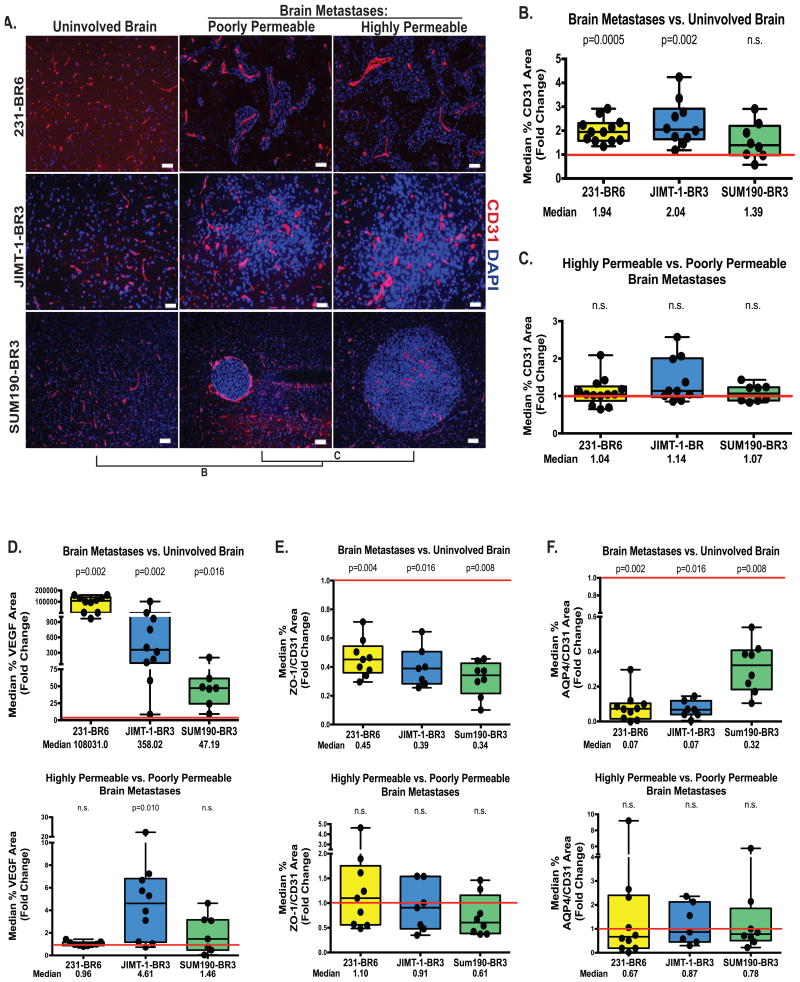
Figure 3. Widespread alterations in the BTB.
For the model systems described in Figure 1, quantitative immunofluorescence was conducted for the CD31 area of endothelial cells (A-B), VEGF (D, top panel), zona occludens-1 tight junction protein (ZO-1, E, top panel) and the aquaporin 4 water channel in astrocyte endfeet (AQP4, F, top panel)(see Methods and Supplementary Methods). Data were plotted as described in Figure 2 with each dot representing the combined lesions of a single mouse brain and the red line indicating unity. Median fold change is listed below, and P values are listed above the plots. All markers demonstrated a statistically significant alteration in expression, when compared to uninvolved brain, in at least two of the model systems. A similar comparison of more permeable to less permeable metastases is shown on panels 3A and C, and the lower panels of D-F. Staining was quantified as described in Figure 2, except that metastasis images were normalized to CD31 staining for B-D. Panel A scale bar=50 μm (231-BR6 and JIMT-1-BR3) scale bar=100 μm (SUM190-BR6). None of these markers were consistently correlated with low versus high BTB permeability.

