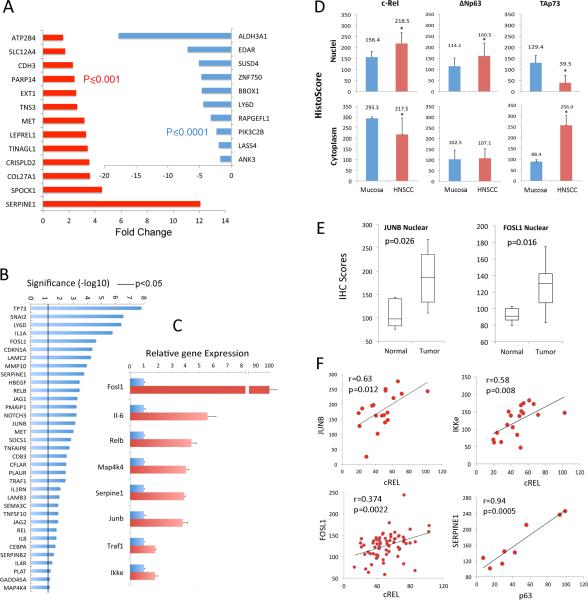
Figure 6. cREL, ΔNp63, and TAp73 nuclear and cytoplasmic localization and target gene expression in human HNSCC tissues and skin of ΔNp63α transgenic mice.
(A) 46 up-regulated and 27 down-regulated genes from Figure 5D were queried using the mRNA expression dataset from TCGA HNSCC project, which includes 279 tumor and 16 mucosa specimens. Significant up-regulation of 13/46 activated genes (red), and down-regulation of 10/27 repressed genes (blue) are detected in TCGA tumors compared to normal samples (fold change ≥1.5, student t-Test with FDR < 1% multivariate comparison correction cut off). (B) Three publicly available datasets of gene profiling microarrays were investigated, which included a total of 125 (67 metastatic and 58 non-metastatic) HNSCC tissues. Pearson correlation coefficients of gene expression between p63 and potential target genes were calculated, and genes exhibiting statistically significant correlation are presented. The line indicates p<0.05. (C) RNA was isolated from the skins of ΔNp63α transgenic mice (red). qRT-PCR was performed to quantify gene expression levels with a statistically significant increase compared with their age-matched non-transgenic littermates (blue, p<0.05). The data were calculated from triplicates of one representative experiment and presented as the mean ± SD. (D) Human HNSCC and normal mucosa frozen sections were stained for cREL, ΔNp63, and TAp73, and intensities within nuclei or cytoplasm in three 200X fields per slide were acquired and quantified using an Aperio Scanscope and Cell Quantification Software (Vista, CA, USA), and presented as mean histoscores ± SD for 8-13 samples. * p<0.05, HNSCC vs normal mucosa by t-tests. (E) Immunohistochemistry comparing transcription factors JUNB and FOSL1 nuclear staining in human HNSCC tissue array. Images were acquired using an Aperio Scanscope at 200X magnification, and staining intensity was quantified using Aperio Cell Quantification Software. Tumor protein expression of evaluable specimens for JUNB and FOSL1 (n=66) and mucosa (n=11) samples. Student t-test, p<0.05 (F) Associations in expression levels between the transcription factors nuclear cREL with targets nuclear JUNB and IKKε (stage III tumors), nuclear cREL with nuclear FOSL1 (in all tumor stages), and nuclear TP63 with nuclear SERPINE1/PAI1 (metastatic tumors). A non-directional test for the significance of the Pearson Product-Moment Correlation Coefficient with the computed histoscores for each protein was used.

