
Fig. 4.
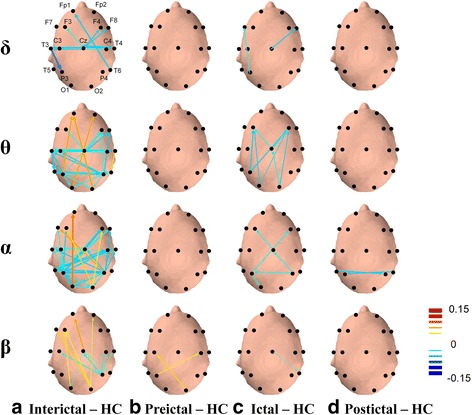
Topographical comparisons of significant EEG coherence differences (p < .05) between patients in different migraine phases and HCs during eyes-open recording. Line sizes and colors reflect the magnitude of the difference in coherence intensity between electrode pairs, with red indicating positive differences (more coherent) and blue indicating negative differences (more independent). The directions of arrows represent the direct paths of inter-channel coupling