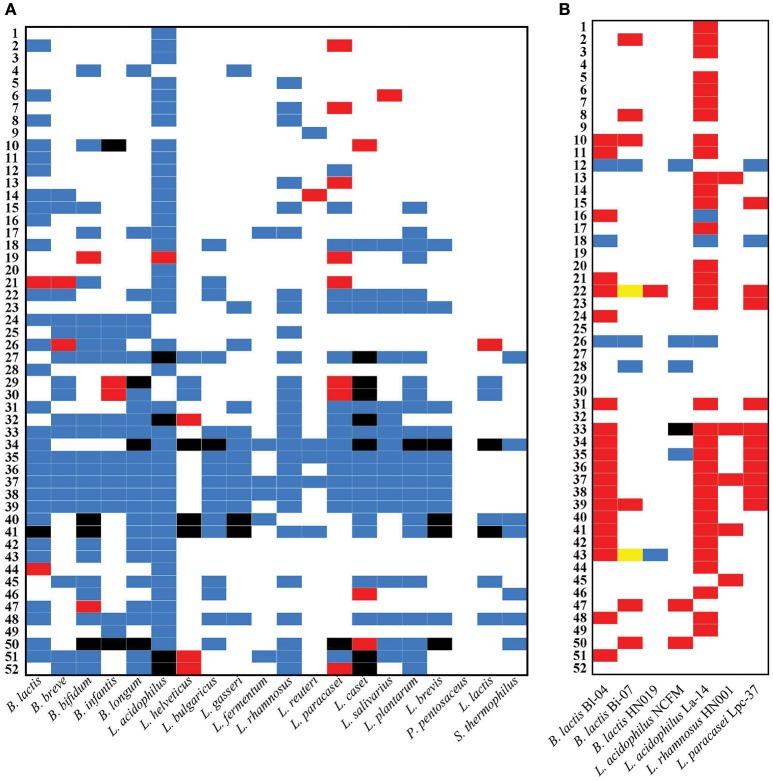
Figure 3.
PCR assay of species, sub-species, and strain identity compared to label claim. The presence of organisms is visualized for (A) the mPCR and (B) the strain-specific PCR assays as different colors: blue denotes claimed and present; white denotes not claimed and absent; red denotes not claimed and present; black denotes claimed and not present; yellow denotes strain-specific assays unable to be fully characterized using the present assays. Samples are ordered based on species taxonomy by 16S rRNA sequence.

