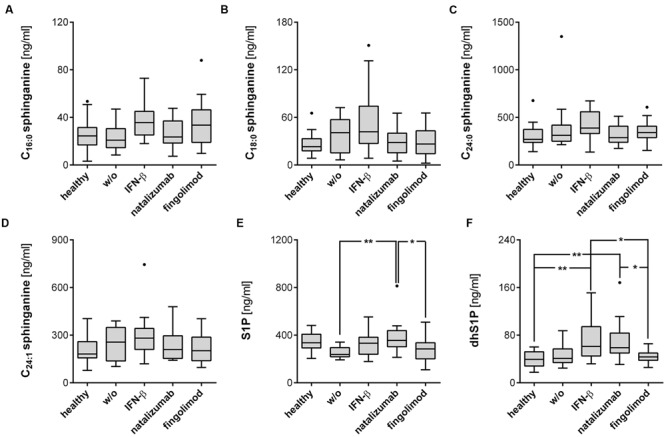
FIGURE 2.

S1P and dhS1P level are affected by the respective treatment regime. (A–D) Sphinganines were determined from plasma of RRMS patients and healthy controls, as well as (E,F) S1P and dhS1P. Data shown are Tukey box plots with a horizontal line representing the median, whiskers representing the 1.5× interquartile range and dots representing outliers. Healthy controls (n = 21), untreated patients (w/o, n = 11), IFN-β (n = 18), natalizumab (n = 16), and fingolimod (n = 24) treated patients. One-Way ANOVA with Tukey’s post hoc comparison test or Kruskal-Wallis’ test with Dunn’s post hoc comparison for normally or non-normally distributed data, respectively. ∗p ≤ 0.05; ∗∗p < 0.01.
