FIGURE 2.

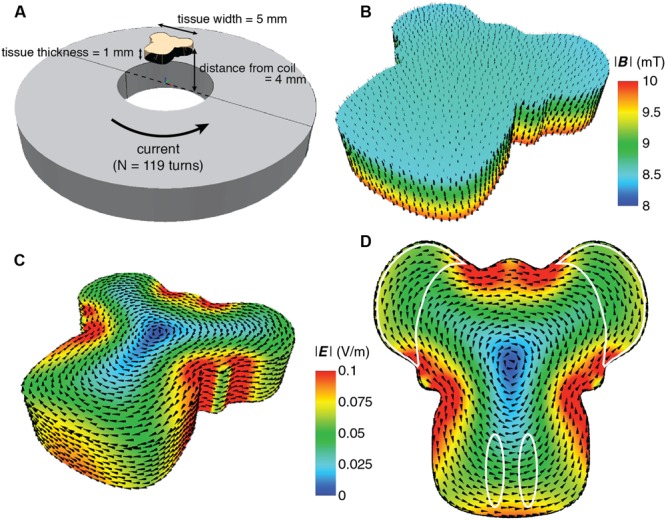
Detailed finite element modeling of the magnetic and electric fields in the explant tissue. (A) Schematic overview of the spatial relation between the coil and the explant. The coil has 119 turns with counter clockwise current flow. Coil dimensions are listed in Table 1. The overall dimension of the explant is 5 mm in width and length, and 1 mm thickness. It is placed 4 mm above the surface of the coil, centered along the coil axis. (B) Simulated magnetic field distribution in the explant. The arrows indicate the direction of the magnetic flux. For illustration purposes, the intensity scale has been limited to between 8 and 10 mT in order to show the intensity gradient throughout the explant. (C) Simulated electric field distribution in the explant. The arrows indicate the direction of the induced current flow. For this figure the upper scale has been limited to 0.1 Vm-1 to demonstrate the range of E intensity within the explant, as it is not visible in Figure 1E. (D) Electric field distribution looking at the side of the tissue closest to the coil. The areas of interest are outlined in white and all receive the same E intensity.
