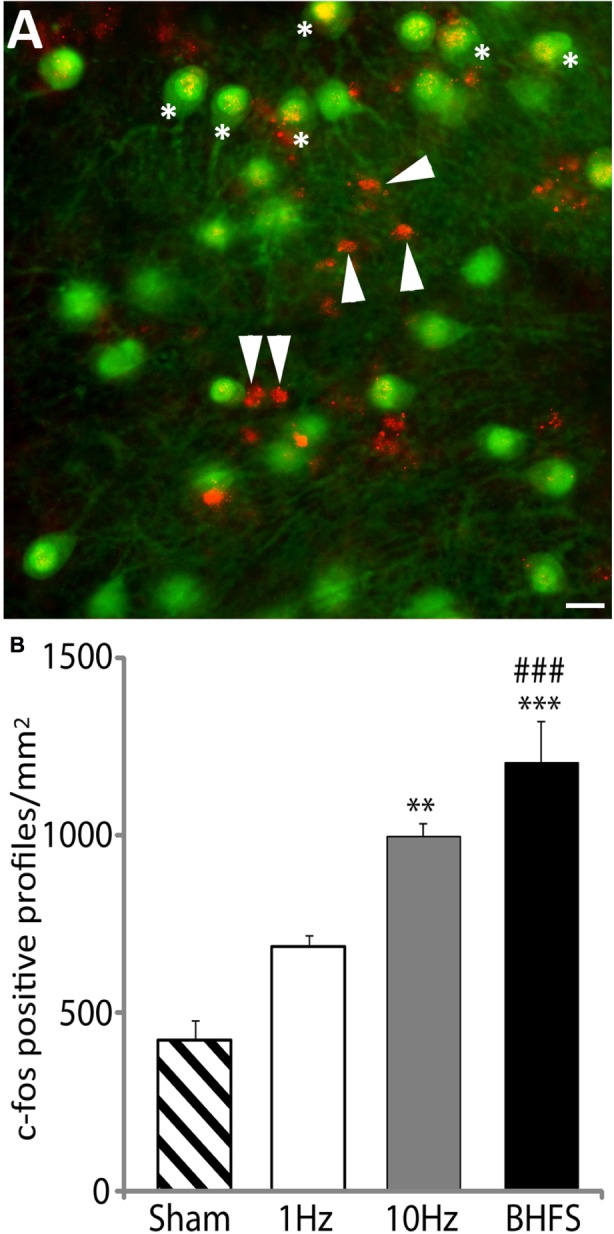
FIGURE 6.

c-fos labeling following LI-rMS in the cerebellar plates. (A) An example of c-fos labeling after stimulation by BHFS. In this case c-fos (red) is co-labeled with calbindin (green) to reveal Purkinje neurons. C-fos labeling is located in some of the Purkinje cell nuclei (∗) and in other calbindin-negative profiles (arrowheads), which are the size and location of either granule or stellate neurons. Bar = 25 μm. (B) Histograms show the number of c-fos positive cellular profiles per mm2 in sham (unstimulated) controls, and explants stimulated with 1 Hz, 10 Hz or BHFS (n = 4 for each group; all four groups contain explants from the same 3 litters). Error bars are standard error of the mean. Cellular labeling in comparison to sham: ∗∗∗p < 0.0001; ∗∗p < 0.01. 1 Hz vs. BHFS between group comparison: ###p < 0.001 (ANOVA followed by post hoc Tukey pairwise comparisons).
