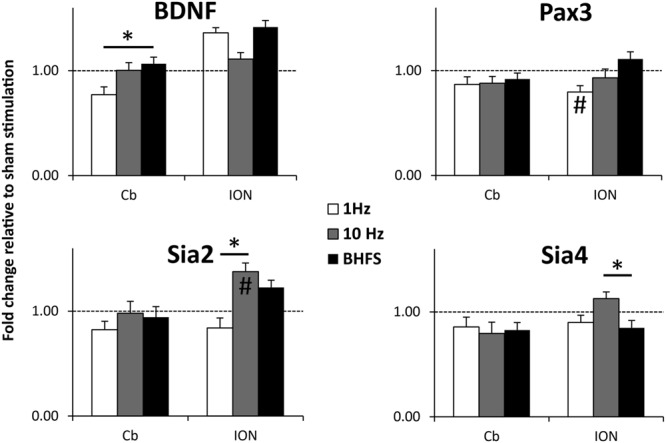
FIGURE 7.

BDNF, Pax3, Sia2, and Sia 4 mRNA expression levels in the cerebellar plate (Cb) and inferior olive (ION) normalized to sham (unstimulated) controls. Explants were stimulated with 1 Hz, 10 Hz or BHFS (n = 5 for each group; all four groups contain pooled tissue from the same 15 litters). Histograms show mRNA levels as fold-change relative to sham (horizontal dotted line at threshold change of 1). Error bars are standard error of the mean, ∗ indicates p < 0.05 and # indicates significantly different compared to sham stimulated controls (p < 0.05) (ANOVA, p < 0.05, followed by post hoc Tukey pairwise comparisons).
