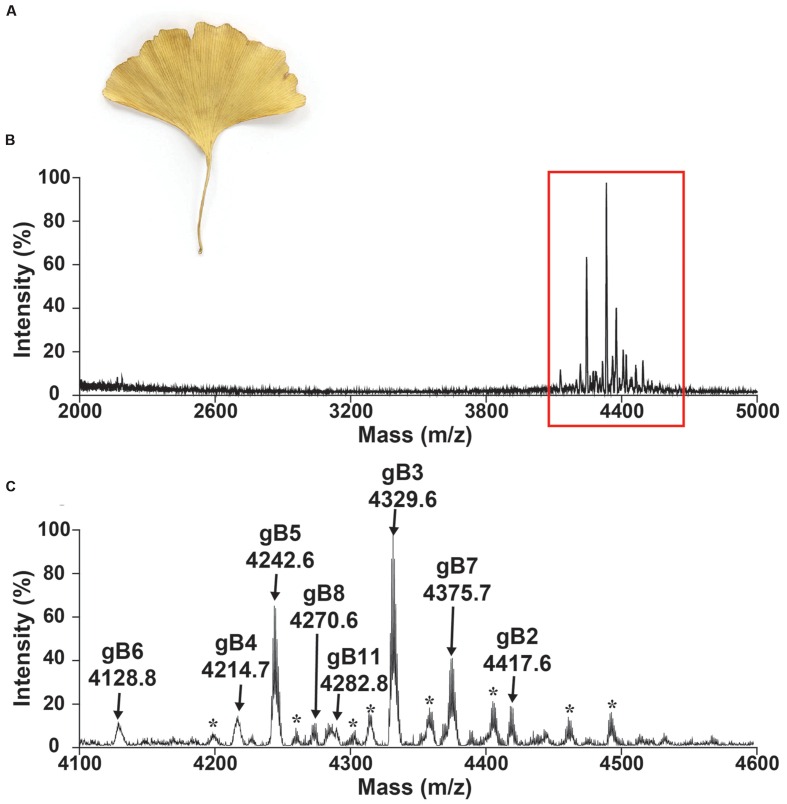
FIGURE 2.
Mass spectrum of dried Ginkgo biloba leaf. Photograph of (A) dried G. biloba leaf. MALDI-TOF MS profile of the dried G. biloba leaf extract in mass range of (B) 2000–5000 and (C) 4100–4600 Da. The dried G. biloba leaf powder (100 mg) was extracted with 1 mL of water. After centrifuged, the supernatant was fractionated using C18 Ziptip and eluted using 80% ethanol. gB1 were not detected but were later isolated in the preparative HPLC. gB9 and gB10 can only be found in the transcriptomic level. ∗ Unknown compounds. Further characterization is required to confirm the identities of these compounds.

