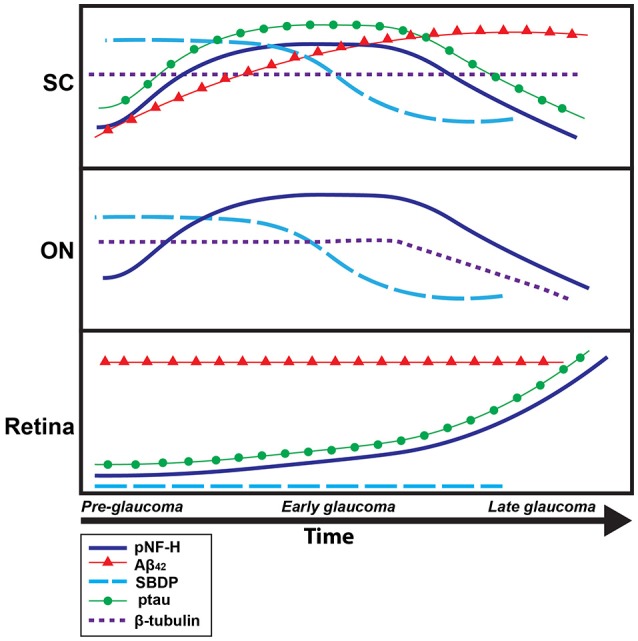
Figure 6.

Timeline summary of protein pathology within the DBA/2J retinal projection. A summary schematic of changes in protein levels over disease progression (pre-glaucomatous, early, and late glaucomatous ages), in the DBA/2J mouse model, for each tissue type analyzed (retina, ON, SC) is shown here. The x-axis corresponds to time while the y-axis corresponds to general protein levels. Each colored line corresponds to a specific protein: dark blue corresponds to pNF-H, red corresponds to Aβ42, light blue corresponds to SBDP, green corresponds to ptau-231, dotted purple corresponds to β-tubulin. Increased/decreased slope of each line indicates increased/decreased concentrations of each specific protein over time.
