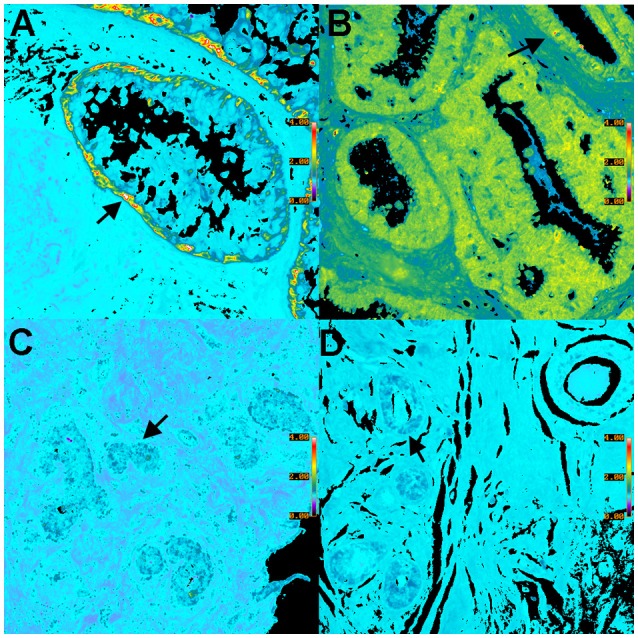
Figure 6.

Pseudocolor BRIM images of CD44hi/CD24lo cells and N-cadhi/E-cadlo cells of DCIS lesions are shown. (A,C) show CD44hi/CD24lo cells whereas (B,D) show N-cadhi/E-cadlo cells. Positive BRIM findings (high ratios) are shown in (A,B). Negative BRIM results (low ratios) are shown in (C,D). Higher ratios are indicated by the red-yellow colors in (A,B). Arrows denote regions of higher ratios. Note that the CD44hi/CD24lo cells are primarily found at the periphery of the ducts in (A). These data show that patients can differ widely in the ratios associated with DCIS. (Ratio scale bars are given along the right hand side of each panel) (20x objective).
