
FIGURE 2.
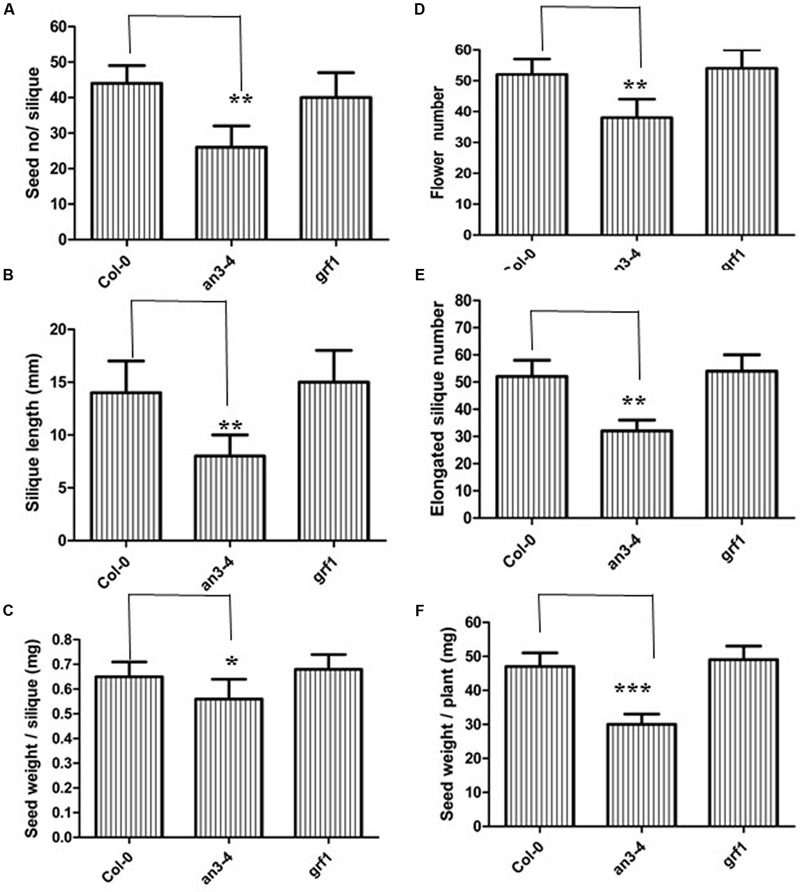
an3-4 mutant plants have low seed yield. For the given plant genotypes representative seed number/silique (A), silique length (B), seed weight/silique (C), flower number (D), elongation silique number (E), and seed weight/plant (F) are shown, respectively. Data are means ± SD from at least 10 independently propagated Col-0, mutant lines or independent transgenic lines (∗∗∗P < 0.001, ∗∗P < 0.01, ∗P < 0.05, respectively; in A, n = 12; in B, n = 10; in C, n = 15; in D, n = 6; in E, n = 6; in F, n = 6).