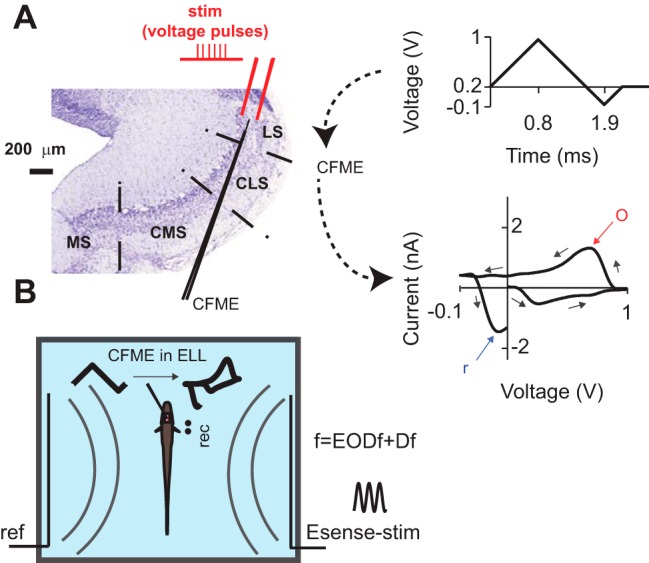
Figure 1.

Nissl-stained transverse section of ELL, and the schematics of in vitro and in vivo experimental setups. A, The stimulating bipolar electrode and the CFME were placed in the ELL pyramidal cell layer. A triangular waveform (top right) sweeping between −0.1 and +1 V at 1000 V/s was applied to the CFME once every 100 ms. The voltage was kept at 0.2 V between the scans. The background-subtracted CV (bottom right, a representative CV from slice recordings) was calculated for each scan. o, Oxidation peak; r, reduction peak. Arrows point to the temporal order of the points in the CV. B, Sketch of the in vivo setup: Esense-stim was presented to the fish with a carrier frequency (f) equal to the EODf of the fish plus Df. ref, Reference electrode; rec, EOD-recording electrode. Curved gray lines schematize the existence of a global electric field but do not represent the actual, more intricate orientation of the electric field lines.
