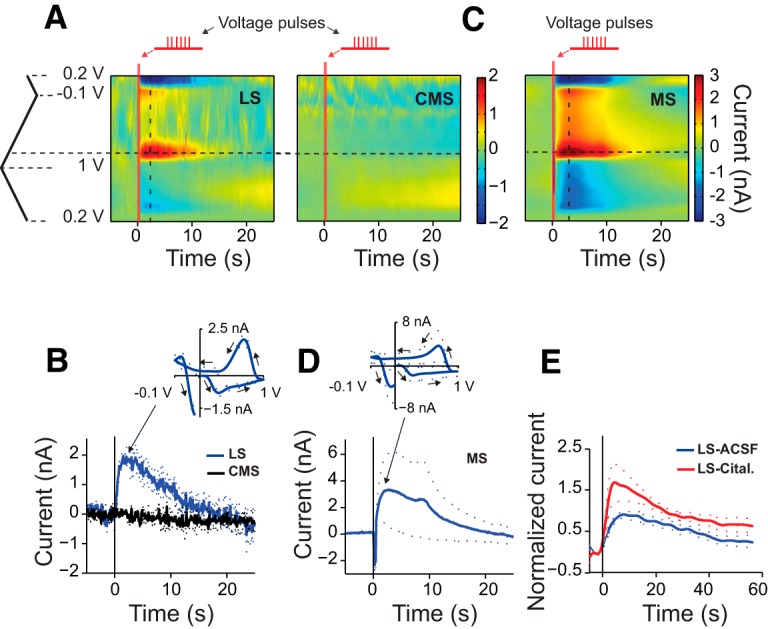
Figure 2.

In vitro electrical stimulation in ELL-PCL evokes 5-HT release in the LS and MS, but not CMS. A, Representative average color plot for electrical stimulation trials in LS (left panel, ntrials = 3, nfish = 1) and CMS (right panel, ntrials = 3, same fish). Each trial for electrical stimulation consisted of the application of 24, 0.1-ms-wide, 20 V voltage pulses at 60 Hz. Vertical red bars depict the onset and duration of electrical stimulation. Horizontal and vertical dashed lines correspond to the peak oxidation voltage and time of the peak current, respectively. B, Time-course of the average (±SEM) current at the peak oxidation voltage for stimulation and recording in LS (blue) and CMS (black). Same fish as in A, ntrials = 3 for each region. Oxidation peak 0.76 V (SD = 0.01 V), reduction peak 0.17 V (SD = 0.01 V). Inset depicts the average (±SEM) CV for LS measured at peak current for these trials. C, Representative average color plot for electrical stimulation trials in MS (ntrials = 3, nfish = 1). Each trial for electrical stimulation consisted of the application of 24, 0.1-ms-wide, 60 V voltage pulses at 60 Hz. D, Time-course of the average (±SEM) current at the peak oxidation voltage for stimulation and recording in MS. The locations of the redox peaks were similar to those found in LS [oxidation peak, 0.77 V (SD, 0.02 V); reduction peak, 0.14 V (SD, 0.01 V)]. Inset depicts the average (±SEM) CV. E, Average normalized current measured at peak oxidation voltage before (ACSF control, black) and after incubation in citalopram (Cital., red; nfish = 3, ntrials = 3 per condition). All currents were normalized to the average peak amplitude under control conditions for each fish. Dashed lines show the SEM.
