Figure 6.

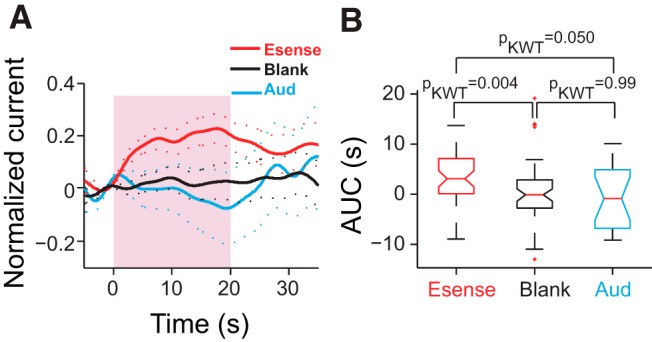
Aud-stim did not modulate 5-HT levels in LS. A, Average normalized peak current (nfish = 4) in response to Esense-stim (red, ntrials = 48) and Aud-stim (blue, ntrials = 18), and during blank trials (black, ntrials = 54). B, The AUC for Aud-stim trials was not significantly different from those of blank trials and was significantly smaller than those for Esense-stim trials. The median is shown with the middle red line; the lower and upper edges of the box plots correspond to the 25th and 75th percentiles; and the whiskers mark the extent of the data points. Outliers are shown as red crosses.
