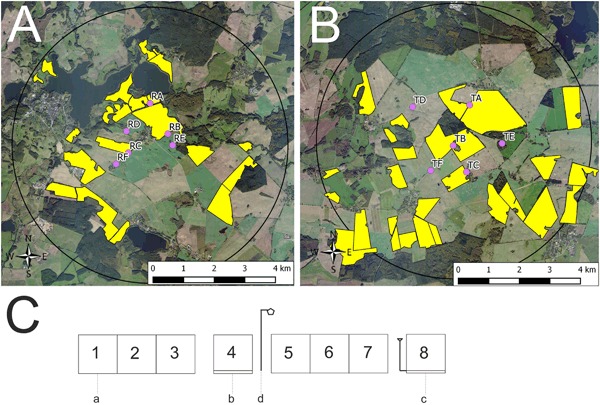
Fig. 1.

Study locations and arrangement of honey bee hives during the exposure phase. In a and b, yellow polygons indicate OSR fields. a Study locations at the reference site. Locations RA, RB, and RC were established at the edge of an OSR field and locations RD, RE, and RF were situated in 400 m distance to the nearest OSR field. b Study locations at the test site. Locations TA, TB, and TC were established at the edge of an OSR field and locations TD, TE, and TF were situated in 400 m distance to the nearest OSR field. c Arrangement of honey bee hives at the study locations during the exposure phase. a = honey bee hive, b = honey bee hive on a hive scale, c = honey bee hive on a hive scale connected to a rain gauge, d = anemometer
