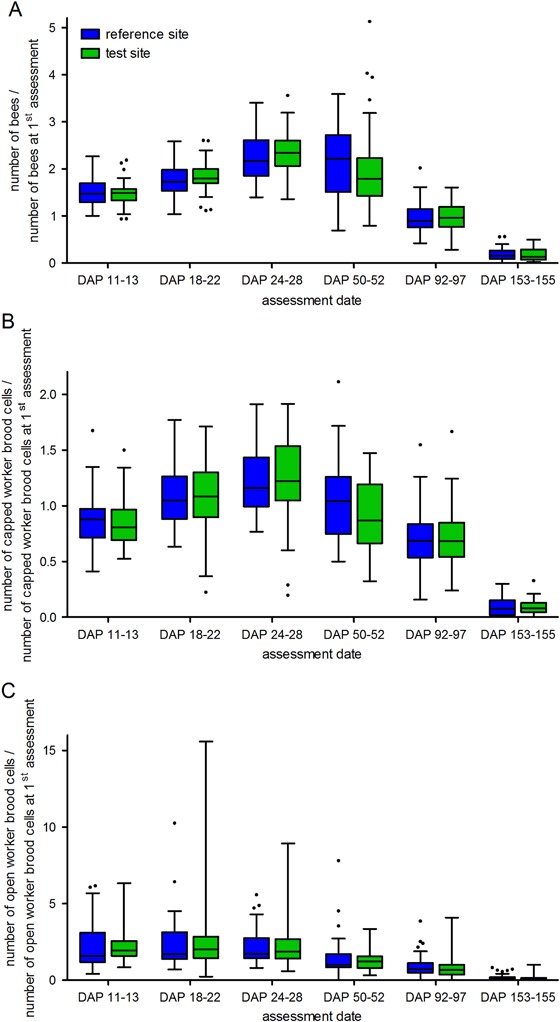
Fig. 2.

Development of the numbers of adult honey bees (a), capped brood cells (b), and open brood cells (c) in colonies located at study locations in the reference site (no clothianidin seed-dressing) and the test site (clothianidin seed-dressing). The box plots contain the 1st and 3rd quartiles, split by the median; traditional Tukey whiskers go 1.5 times the interquartile distance or to the highest or lowest point, whichever is shorter. Any data beyond these whiskers are shown as points. DAP day after placement
