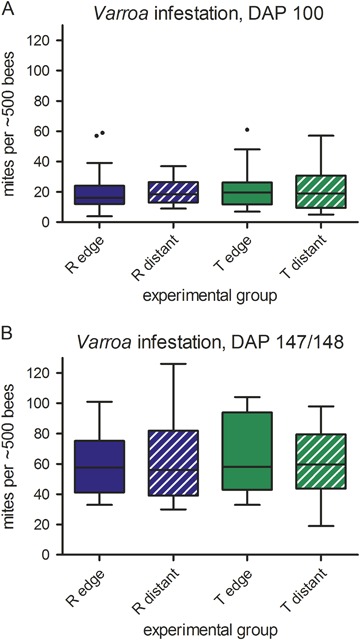
Fig. 6.

Number of Varroa mites per approx. 500 honey bees at DAP +100 (a) and at DAP +147/148 (b) in colonies belonging to different experimental groups during the exposure phase as determined by the icing sugar method. At DAP +147/148, sample sizes differ due to lost colonies (CA-1, CA-2, CB-3, CB-8, CF-4, TA-6, TC-4, TC-5, TD-6, TD-8), swarming (TB-4), and queen loss (TC-7). The box plots contain the 1st and 3rd quartiles, split by the median; traditional Tukey whiskers go 1.5 times the interquartile distance or to the highest or lowest point, whichever is shorter. Any data beyond these whiskers are shown as points. DAP day after placement
