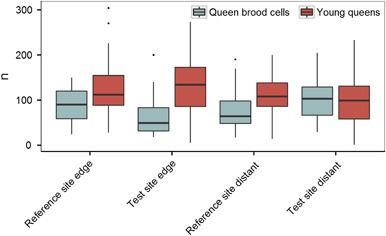
Fig. 7.

Numbers of young queens and queen cells at the end of the experiment. Bumble bee colonies were frozen, and the number of young queens and queen cells were determined. Bumble bee hives were either placed in a landscape with OSR fields treated with clothianidin seed dressing (test site) or untreated fields (reference site). Hives were either placed at the edge of the fields (edge) or ca. 400 m distant from the fields (distant). During the study, all hives were fitted with a queen lock to prevent young queens from escaping, so that a reliable determination of their number was possible at the end of the experiment. The upper and lower hinges of the boxplot correspond to the first and third quartiles (the 25th and 75th percentiles). Whiskers extend from the highest value to the lowest value within 1.5 times the interquartile range. Data beyond the end of the whiskers are plotted as points
