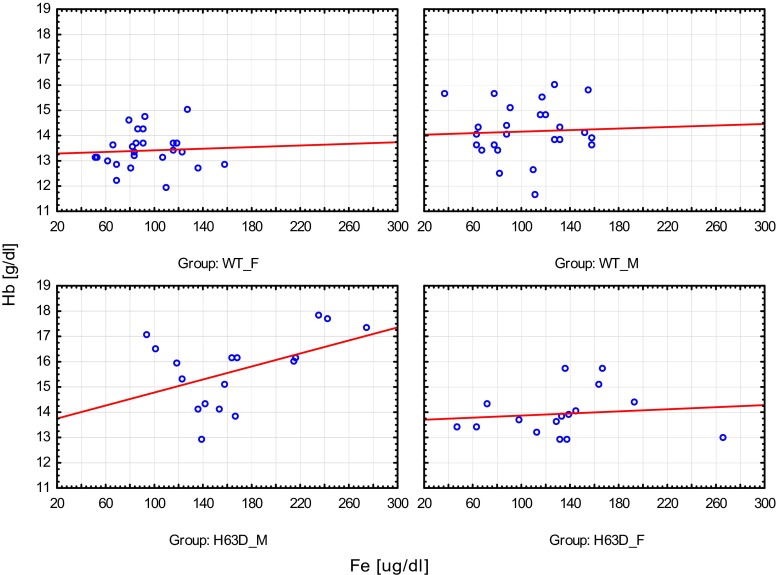
Fig. 2.
Correlation between iron and hemoglobin concentration in gender groups. There were no statistical differences. Wild-type female group (WT_F): y = 13.2572 + 0.0016*x; r = 0.0580; p = 0.7832; r 2 = 0.0034. Wild-type male group (WT_M): y = 14.0069 + 0.0015*x; r = 0.0473; p = 0.8225; r 2 = 0.0022. Carriers male group (H63D_M): y = 13.4959 + 0.0128*x; r = 0.4658; p = 0.0595; r 2 = 0.2170. Carriers female group (H63D_F): y = 13.6595 + 0.0021*x; r = 0.1208; p = 0.6559; r 2 = 0.0146

