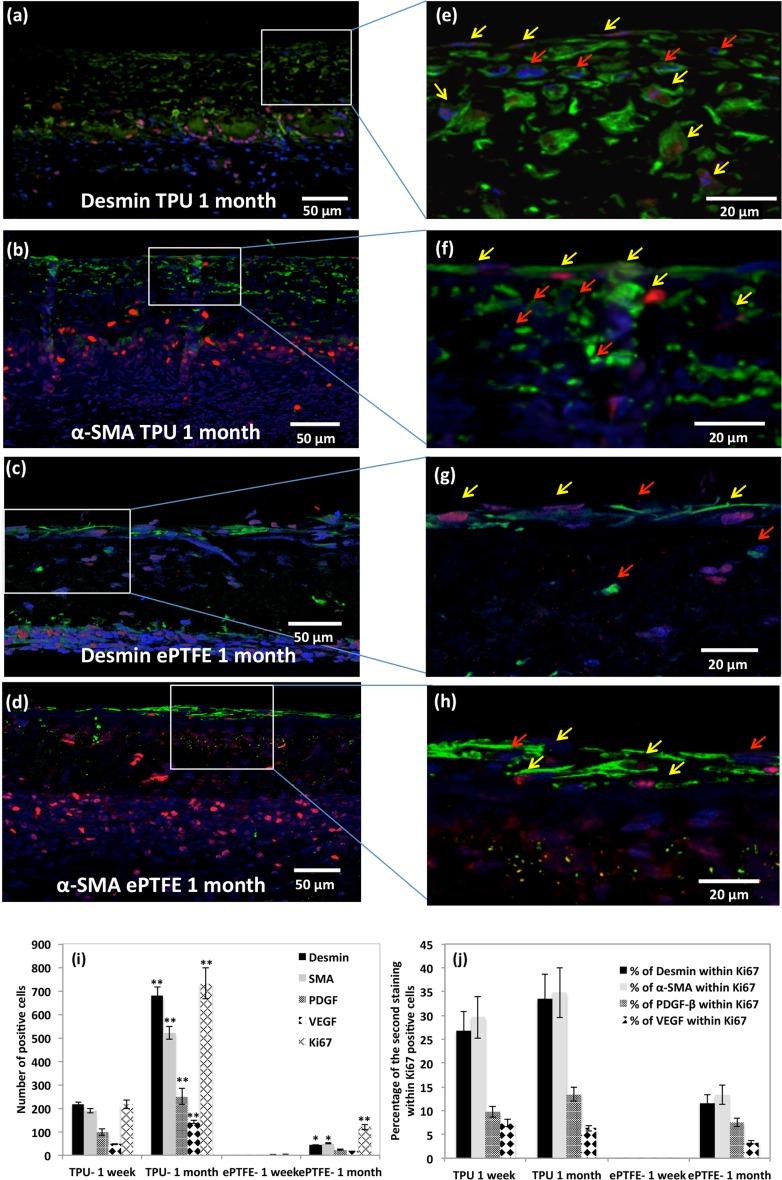
Figure 7.
(a, b, c and d) Representative images of double immunofluorescence stained serial sections of TPU and ePTFE grafts after 1 month implantation showing host cell infiltration of Ki67+ cells (red), α-SMA+ and desmin+ cells (in green). Nuclei counterstained with DAPI (blue), scale bar: 50 μm. (e,f,g and h) Magnified view of mid graft region; red arrows: ki67− and desmin+/α-SMA+ cells, yellow arrows: co-expression of ki67-α-SMA or ki67-desmin of the infiltrated cells, scale bar: 20 μm. (i) Quantification of the number of desmin+, α-SMA+, PDGF+, VEGF+, Ki67+ cells which migrated into the graft wall of TPU and ePTFE specimens (1 week, 1 month implantation, n = 4). Data are expressed as mean ± SD. *(p < 0.05) ** (p < 0.001) indicate statistical differences in cell populations between the two time points in each individual graft. (j) Percentage of desmin+, α-SMA+, PDGF+, VEGF+ cells within Ki67+ cells (n = 4).

