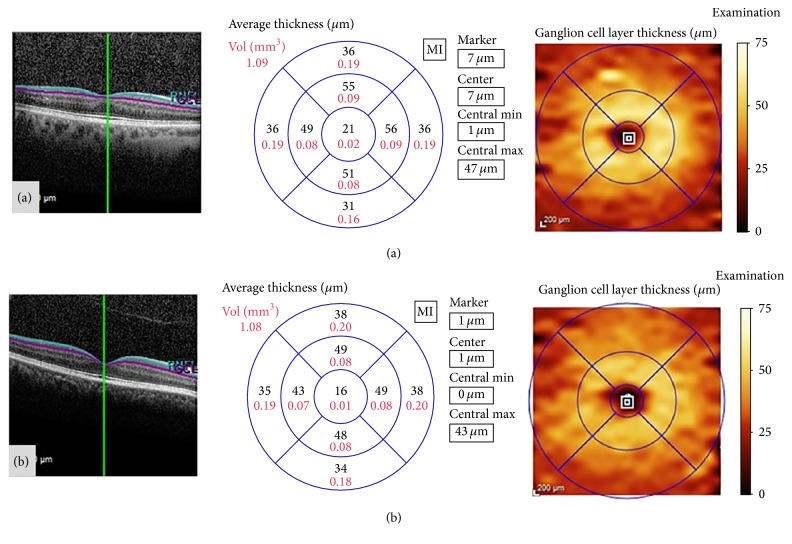
Figure 4.
Example of segmentation analysis of the macular ganglion cell layer, obtained with Spectralis optical coherence tomography, in a healthy control (a) and a patient diagnosed with Parkinson disease (b). The segmentation report shows the ganglion cell layer thickness (in microns) and total volume (in mm3) of the ETDRS macular area. In this patient (b), the central and inner macular areas present thinning of the ganglion cell layer, compared with the healthy control (a).

