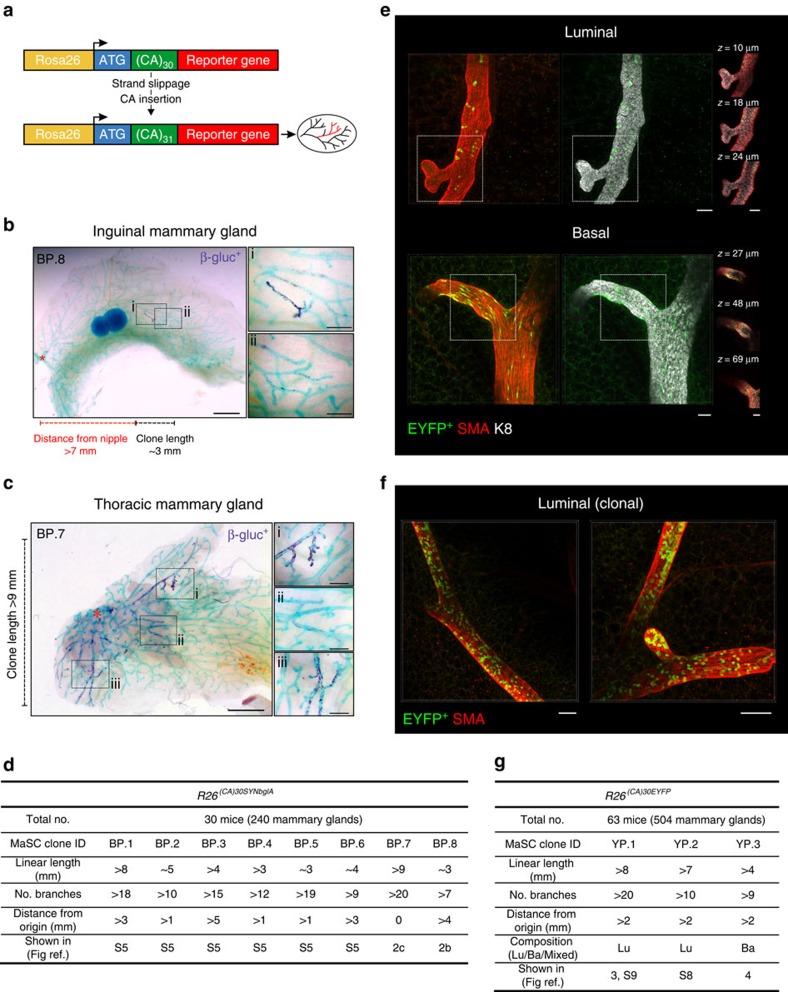
Figure 2. Single-cell lineage tracing in the virgin mammary gland.
(a) Schematic representation of the R26[CA]30 mouse model. (b,c) Examples of two large clonally marked regions (BP.8 and BP.7) in mammary glands from R26[CA]30SYNbglA mice that were likely to have arisen from the labelling of a MaSC/progenitor (based on linear length and number of label-positive branches) (d). Dark purple staining is β-glucosidase+ cells; mammary tissue was counterstained with methyl green. Annotations show the linear length of the clones and their distance from the nipple region (asterisk). Clone BP.7 originated in the nipple region and is likely to have been labelled very early in development. Scale bars, 2 mm (overview) and 0.5 mm (inset). (d) A summary of the eight clonally marked regions likely to have arisen from the labelling of a MaSC/progenitor, observed from the analysis of 30 R26[CA]30SYNbglA mice. (e) Examples of luminal (top panel) and basal (bottom panel) EYFP+ cells from R26[CA]30EYFP mice representing over 25 label-positive regions. Scale bars, 50 μm. (f) A large clonally marked region containing many EYFP+ cells. Labelled progeny spanned multiple ducts and exhibited a sporadic labelling pattern, intermixed with unlabelled cells. Scale bars, 100 μm. (g) A summary of three clonally marked regions presumed to have arisen from the labelling of a MaSC/progenitor, observed from the analysis of 63 R26[CA]30EYFP mice. Lu, luminal; Ba, basal.

