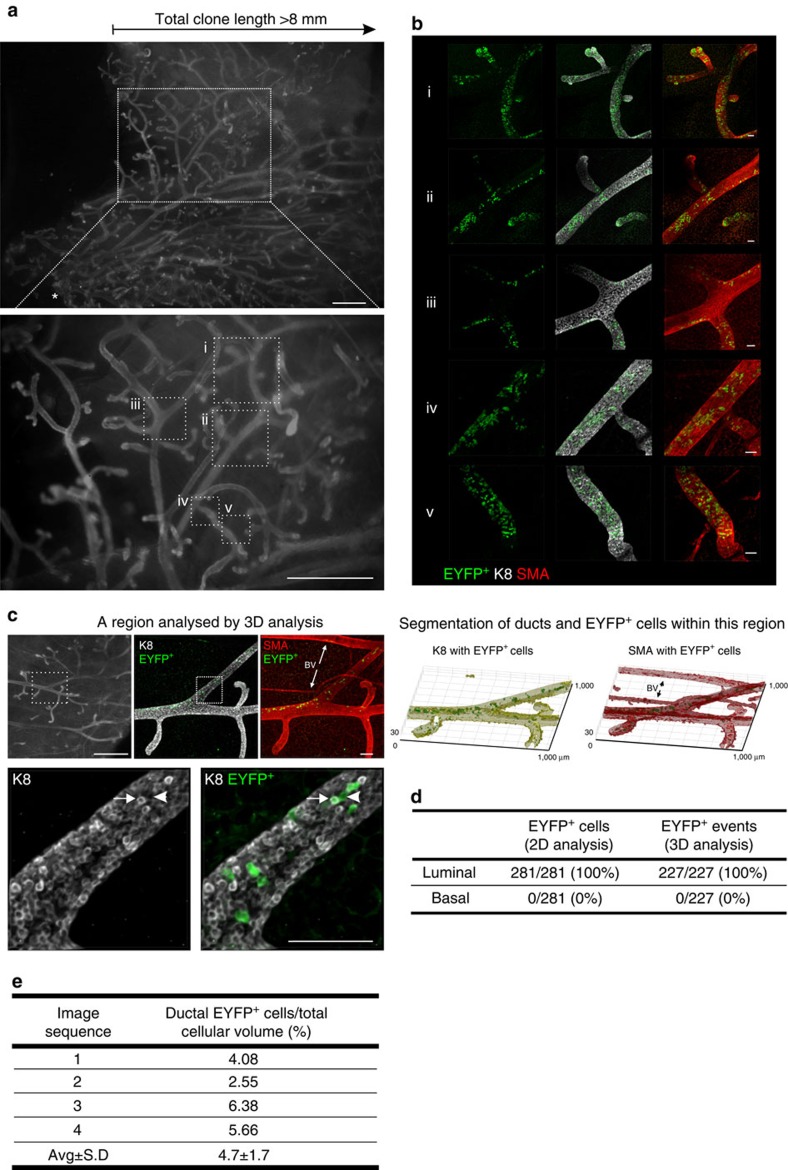
Figure 3. 3D analysis of a clone arising from a single labelled luminal presumptive MaSC.
(a) Wholemount fluorescence images (K8 immunofluorescence) of the mammary ductal network demarcating the linear length of the clone and one region (magnified views, i–v) that was imaged at high cellular resolution by confocal microscopy in b. Further regions from this clone are shown in Supplementary Fig. 9. Asterisk shows the location of the nipple. Scale bar, 1 mm (wholemount) and 50 μm (confocal). (c) Images of a clonally marked region that was analysed by 3D image analysis. Digital segmentation of EYFP+ cells within the luminal (K8-expressing) and basal (SMA-expressing) compartments is shown. Original 3D images show that progeny from a single luminal MaSC/progenitor included both K8hi (arrow) and K8lo (arrowhead) cells. BV, blood vessel. Scale bars, 1 mm (wholemount) and 100 μm (confocal). (d) Tabulated results of 3D and two-dimensional (2D) clonal analyses. For 3D analysis, all segmented ductal EYFP+ cells were classified as luminal based on the proportion of K8 versus SMA signal (n=227 cells from 4 image sequences). For 2D analysis, cells were classified by manual scoring of histological sections (n=281 cells from 10 sections spanning 300 μm depth). This clone (YP.1) is one of three clones likely to have arisen from the labelling of a MaSC (based on linear length and number of label-positive branches), identified from the analysis of over 500 mammary glands from 63 hemizygous R26[CA]30EYFP pubertal mice. (e) Tabulated results of the computed volumetric ratio of EYFP+ cells with respect to cellular volume for each of the four regions analysed.

