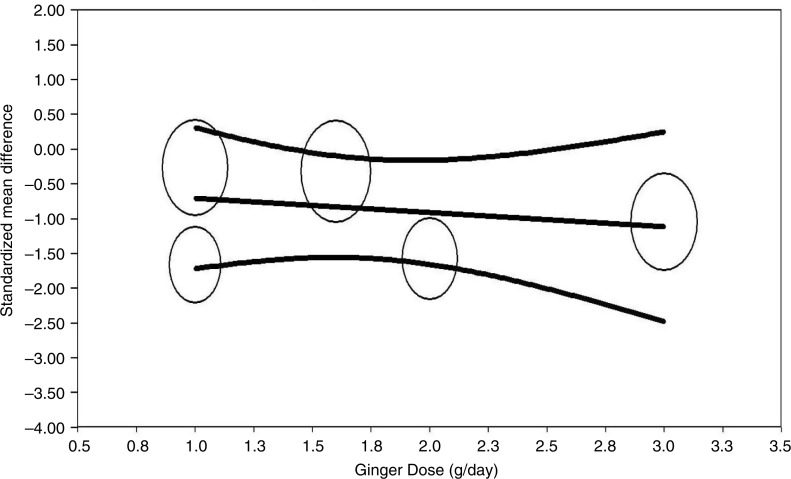
Fig. 3.
Regression of standardized mean difference on dose. Meta-regression plots of the association between mean changes in C-reactive protein (CRP) after ginger supplementation with dose of treatment. Circles represent each study, middle line is regression line, and two lines around the middle line represent the 95% confidence interval.

