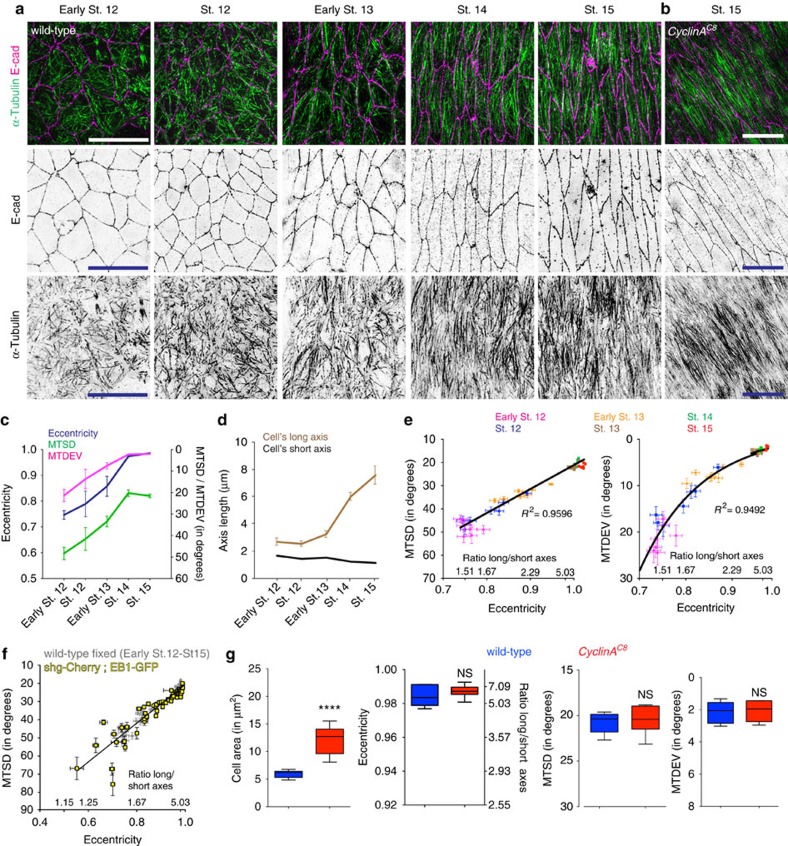
Figure 2. Changes in epidermal cell shape and MT organization correlate during embryogenesis.
(a,b) Representative images of dorsal–lateral epidermis, visualized as described in Fig. 1, from wild-type embryos at the developmental stages and a CyclinAC8 mutant embryo, with the latter shown at lower magnification (b). Scale bars, 10 μm. (c,d) Quantification of cell eccentricity (c, blue), MT alignment (MTSD; c, green), alignment of MTs with the long axis of the cell (MTDEV; c, magenta), cell's long (d, brown) and short (d, black) axis length in wild-type embryos at the stages (St) shown. Cells from 7 embryos per developmental stage from 1 (Early St 12, St 13–15) and 2 (St 12 and Early St 13) independent experiments were analysed. Error bars show mean±s.d. (e) Correlation between MTSD (left) or MTDEV (right) with cell elongation (eccentricity/aspect ratio). Each dot represents cells from a single embryo (mean±s.e.m.). (f) Correlation between MTSD and elongation is the same in fixed embryos, in which alignment of MTs visualized by α-Tubulin staining was analysed (from e, grey), and live embryos expressing EB1-GFP (yellow), in which alignment of EB1 comet trajectories was analysed. Each dot in yellow represents a cell with mean±s.e.m. of MTSD and eccentricity from 10 consecutive time intervals. 58 cells from 8 embryos between St 12 and St 15 from three independent experiments were analysed. (g) Quantification of cell area, cell eccentricity and aspect ratio of long/short axes, MTSD and MTDEV in cells of wild-type (blue) and CyclinAC8 (red) stage 15 embryos. Cells from seven embryos per genotype from three independent experiments were analysed. Statistical analyses were performed with unpaired t-test. ****P<0.0001. NS, not significantly different.

