Figure 7.

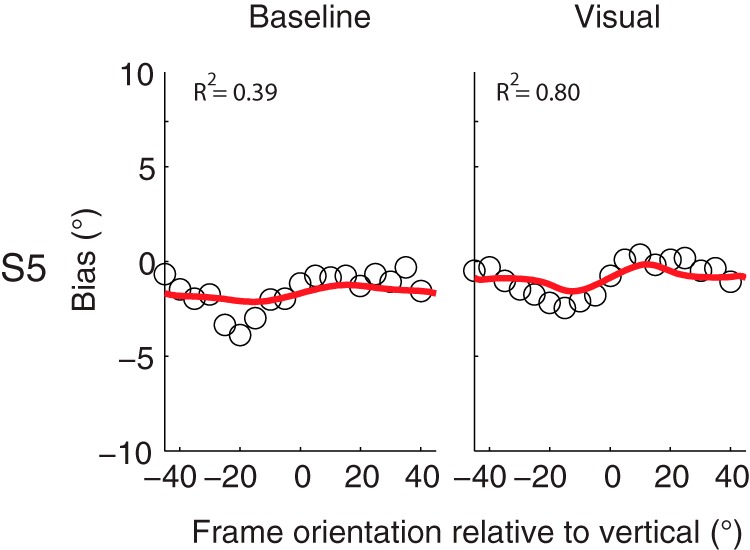
Bias plotted against frame orientation in the baseline and visual condition for subject S5. Red solid lines indicate the best fit of the Bayesian optimal integration model. R 2 values indicate the goodness of fit of the model to the data.

Bias plotted against frame orientation in the baseline and visual condition for subject S5. Red solid lines indicate the best fit of the Bayesian optimal integration model. R 2 values indicate the goodness of fit of the model to the data.